
Compare Dam Capital Advi with Similar Stocks
Stock DNA
Capital Markets
INR 1,018 Cr (Micro Cap)
14.00
20
0.00%
0.00
21.90%
3.00
Total Returns (Price + Dividend) 
Latest dividend: 1 per share ex-dividend date: Jun-13-2025
Risk Adjusted Returns v/s
Returns Beta

News
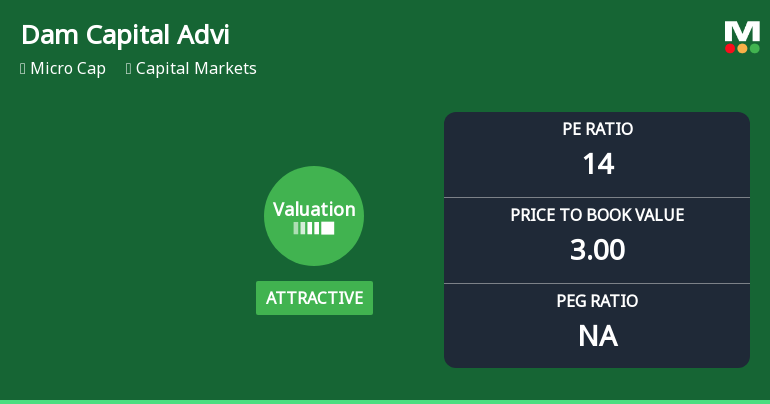
Dam Capital Advisors Ltd Valuation Shifts Signal Renewed Price Attractiveness
Dam Capital Advisors Ltd has witnessed a notable shift in its valuation parameters, moving from a fair to an attractive rating, despite ongoing headwinds reflected in its share price performance. This recalibration in price-to-earnings and price-to-book value metrics, alongside robust return ratios, offers investors a fresh perspective on the stock’s price attractiveness relative to its historical and peer benchmarks.
Read full news article
Dam Capital Advisors Ltd is Rated Sell
Dam Capital Advisors Ltd is rated 'Sell' by MarketsMOJO, with this rating last updated on 23 May 2026. However, the analysis and financial metrics discussed here reflect the stock's current position as of 06 June 2026, providing investors with the most up-to-date view of the company’s fundamentals, returns, and market performance.
Read full news article
Dam Capital Advisors Ltd is Rated Sell
Dam Capital Advisors Ltd is rated 'Sell' by MarketsMOJO, with this rating last updated on 23 May 2026. However, the analysis and financial metrics discussed here reflect the stock's current position as of 05 June 2026, providing investors with an up-to-date view of the company’s fundamentals, returns, and market standing.
Read full news article Announcements
Compliances-Reg.24(A)-Annual Secretarial Compliance
29-May-2026 | Source : BSEAnnual Secretarial Compliance Report of the Company for the financial year ended March 31 2026.
Announcement under Regulation 30 (LODR)-Newspaper Publication
24-May-2026 | Source : BSENewspaper Publication - Audited Financial Results of the Company.
Audited Standalone & Consolidated Financial Results For Quarter And Year Ended March 31 2026
23-May-2026 | Source : BSEAudited Standalone and Consolidated Financial Results of the Company for the quarter and year ended March 31 2026.
Corporate Actions

No Upcoming Board Meetings

Dam Capital Advisors Ltd has declared 50% dividend, ex-date: 13 Jun 25

No Splits history available

No Bonus history available

No Rights history available
Quality key factors
Valuation key factors
Technicals key factors
 Technical Indicator Scale: Bearish, Mildly Bearish, Sideways, Mildly Bullish, Bullish Turned
 Shareholding Snapshot : Mar 2026
Shareholding Compare (%holding)
Non Institution
None
Held by 5 Schemes (1.09%)
Held by 12 FIIs (2.19%)
Dharmesh Anil Mehta (20.38%)
Vq Fastercap Fund (5%)
38.59%
Quarterly Results Snapshot (Consolidated) - Mar'26 - QoQ

QoQ Growth in quarter ended Mar 2026 is -58.15% vs -34.67% in Dec 2025
QoQ Growth in quarter ended Mar 2026 is -98.75% vs -61.53% in Dec 2025
Half Yearly Results Snapshot (Standalone) - Sep'25
Not Applicable: The company has declared_date for only one period
Not Applicable: The company has declared_date for only one period
Nine Monthly Results Snapshot (Standalone) - Dec'25
Not Applicable: The company has declared_date for only one period
Not Applicable: The company has declared_date for only one period
Annual Results Snapshot (Consolidated) - Mar'26
YoY Growth in year ended Mar 2026 is -4.53% vs 37.94% in Mar 2025
YoY Growth in year ended Mar 2026 is -29.96% vs 47.14% in Mar 2025
About Dam Capital Advisors Ltd

Company Coordinates


