
Compare Danlaw Tech. with Similar Stocks
Dashboard
High Management Efficiency with a high ROCE of 25.66%
Strong ability to service debt as the company has a low Debt to EBITDA ratio of 0.76 times
Healthy long term growth as Net Sales has grown by an annual rate of 56.60% and Operating profit at 54.81%
With a growth in Net Profit of 112.95%, the company declared Very Positive results in Mar 26
With ROE of 23.1, it has a Attractive valuation with a 5.3 Price to Book Value
Market Beating performance in long term as well as near term
Stock DNA
Industrial Manufacturing
INR 541 Cr (Micro Cap)
23.00
19
0.00%
0.03
23.05%
5.32
Total Returns (Price + Dividend) 
Danlaw Tech. for the last several years.
Risk Adjusted Returns v/s
Returns Beta

News
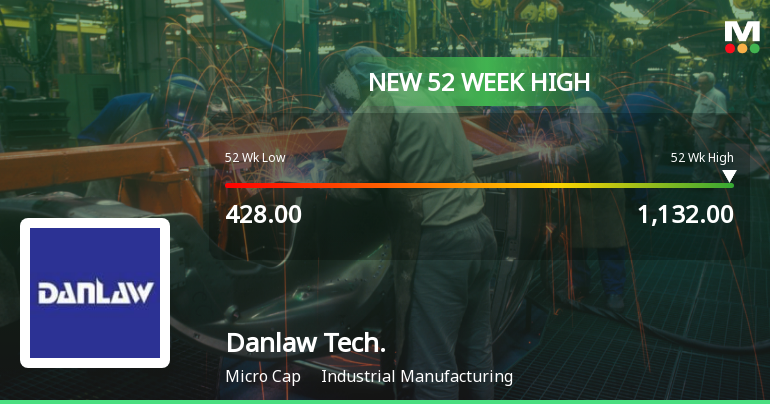
Broad-Based Technical Strength Lifts Danlaw Technologies India Ltd to 52-Week High of Rs 1132
With a decisive break above Rs 1130, Danlaw Technologies India Ltd has reached a fresh 52-week high on 18 Jun 2026, marking a significant milestone in its price momentum. The stock’s recent surge reflects a confluence of bullish technical indicators and sustained upward price action that has outpaced both its sector and the broader market.
Read full news article
Danlaw Technologies India Ltd Upgraded to Strong Buy on Robust Financials and Technicals
Danlaw Technologies India Ltd has been upgraded from a Buy to a Strong Buy rating, reflecting significant improvements across quality, valuation, financial trends, and technical indicators. The micro-cap industrial manufacturing company’s recent performance and market positioning have prompted this positive reassessment, signalling strong potential for investors.
Read full news article
Danlaw Technologies India Ltd: Technical Momentum Shifts Signal Bullish Outlook
Danlaw Technologies India Ltd has demonstrated a marked shift in price momentum, supported by a confluence of bullish technical indicators. The stock’s recent surge to ₹1,038.30, up 5.00% on the day, reflects renewed investor confidence as key momentum oscillators and moving averages align favourably, signalling a robust uptrend in the industrial manufacturing sector.
Read full news article Announcements
Compliances-Reg.24(A)-Annual Secretarial Compliance
29-May-2026 | Source : BSEIn terms of Regulation 24A of the SEBI (Listing Obligations and Disclosure Requirements)Regulations 2015 we are submitting herewith the Annual Secretarial Compliance Report of the Company for the financial year ended 31st March 2026 duly issued by CS B V Sarvana Kumar Practicing Company Secretary.
Announcement under Regulation 30 (LODR)-Newspaper Publication
29-May-2026 | Source : BSEIn terms of Regulation 47 of the SEBI (LODR) Regulations 2015 the company has published its financial results for the quarter and year ended 31st March 2026 in Business Standard in English Language and in Ninadam in Telugu language on 29th May 2026.
Announcement under Regulation 30 (LODR)-Change in Management
28-May-2026 | Source : BSE1. Appointment of Ms. Pallavi Dandu as an Additional Director(Non Executive and Non Independent Director)with effect from 1st July2026 2. Resignation of Mrs. Sridevi Madati from the position of Director with effect 30th June 2026 due to pre-occupation and other commitments
Corporate Actions

No Upcoming Board Meetings

No Dividend history available

No Splits history available

No Bonus history available

No Rights history available
Quality key factors
Valuation key factors
Technicals key factors
 Technical Indicator Scale: Bearish, Mildly Bearish, Sideways, Mildly Bullish, Bullish Turned
 Shareholding Snapshot : Mar 2026
Shareholding Compare (%holding)
Promoters
None
Held by 0 Schemes
Held by 0 FIIs
Danlaw Systems India Ltd (30.01%)
Pannu Bhansali (1.52%)
31.97%
Quarterly Results Snapshot (Standalone) - Mar'26 - QoQ

QoQ Growth in quarter ended Mar 2026 is 29.98% vs -6.11% in Dec 2025
QoQ Growth in quarter ended Mar 2026 is 112.95% vs -18.55% in Dec 2025
Half Yearly Results Snapshot (Standalone) - Sep'25
Growth in half year ended Sep 2025 is 18.71% vs 5.12% in Sep 2024
Growth in half year ended Sep 2025 is 12.27% vs -16.60% in Sep 2024
Nine Monthly Results Snapshot (Standalone) - Dec'25
YoY Growth in nine months ended Dec 2025 is 16.56% vs 4.42% in Dec 2024
YoY Growth in nine months ended Dec 2025 is 8.47% vs -20.56% in Dec 2024
Annual Results Snapshot (Standalone) - Mar'26
YoY Growth in year ended Mar 2026 is 19.96% vs 3.51% in Mar 2025
YoY Growth in year ended Mar 2026 is 21.51% vs -14.89% in Mar 2025
About Danlaw Technologies India Ltd

Company Coordinates


