
Compare Danube Industrie with Similar Stocks
Stock DNA
Trading & Distributors
INR 77 Cr (Micro Cap)
56.00
17
0.00%
0.91
3.85%
1.97
Total Returns (Price + Dividend) 
Danube Industrie for the last several years.
Risk Adjusted Returns v/s
Returns Beta

News
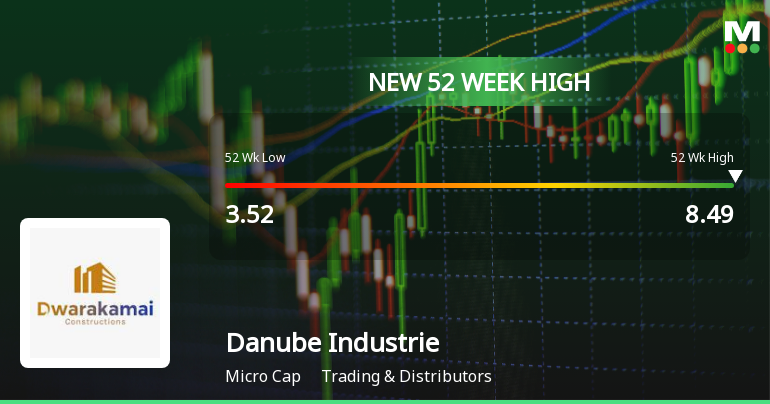
Broad-Based Technical Strength Lifts Danube Industries Ltd to 52-Week High of Rs 8.49
Surging past Rs 8.49 on 25 Jun 2026, Danube Industries Ltd has marked a significant milestone by hitting a fresh 52-week high. This rally, driven by a confluence of bullish technical indicators and sustained price momentum, has propelled the stock to outperform its sector and the broader market over the past year.
Read full news article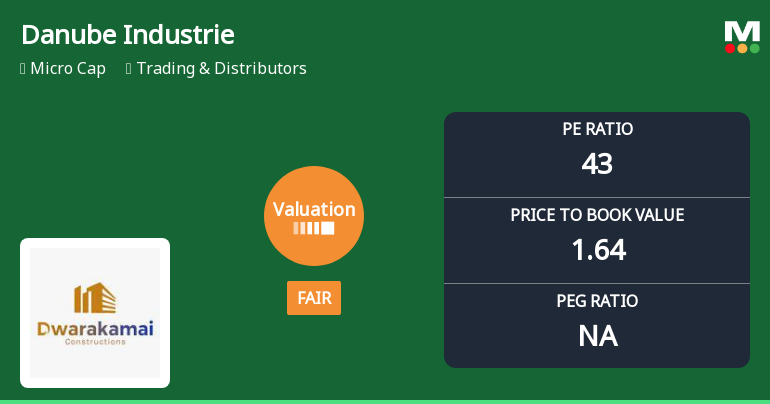
Danube Industries Ltd Valuation Shifts to Fair Amid Mixed Market Returns
Danube Industries Ltd, a micro-cap player in the Trading & Distributors sector, has witnessed a notable shift in its valuation parameters, moving from an attractive to a fair rating. This change reflects evolving market perceptions amid a volatile trading environment, with key valuation metrics such as the price-to-earnings (P/E) and price-to-book value (P/BV) ratios signalling a recalibration of price attractiveness relative to historical and peer benchmarks.
Read full news article
Danube Industries Ltd Upgraded to Sell on Technical Improvements Despite Financial Challenges
Danube Industries Ltd has seen its investment rating upgraded from Strong Sell to Sell as of 17 June 2026, driven primarily by a shift in technical indicators. Despite ongoing financial challenges and weak long-term fundamentals, the stock’s improved technical profile and attractive valuation metrics have prompted a reassessment of its market stance.
Read full news article Announcements
Announcement under Regulation 30 (LODR)-Press Release / Media Release
22-Jun-2026 | Source : BSEPress Release
Announcement under Regulation 30 (LODR)-Change in Management
09-Jun-2026 | Source : BSEAppointment of Mr. Ajay Kumar Jha(DIN : 01795697) as a Non-Executive Non Independent (Additional) Director of the Company Subject to the approval of the Members of the Company with effect from 9th June 2026 liable to retire by rotation.
Compliances-Reg.24(A)-Annual Secretarial Compliance
30-May-2026 | Source : BSEAttached
Corporate Actions

No Upcoming Board Meetings

No Dividend history available

Danube Industries Ltd has announced 2:10 stock split, ex-date: 15 Feb 22

Danube Industries Ltd has announced 1:1 bonus issue, ex-date: 20 Sep 23

No Rights history available
Quality key factors
Valuation key factors
Technicals key factors
 Technical Indicator Scale: Bearish, Mildly Bearish, Sideways, Mildly Bullish, Bullish Turned
 Shareholding Snapshot : Mar 2026
Shareholding Compare (%holding)
Non Institution
None
Held by 0 Schemes
Held by 0 FIIs
Sunil Hukumat Rajdev (39.47%)
Rameshkumar S Thakkar (4.07%)
56.11%
Quarterly Results Snapshot (Standalone) - Mar'26 - YoY

YoY Growth in quarter ended Mar 2026 is -10.02% vs 17.89% in Mar 2025
YoY Growth in quarter ended Mar 2026 is -56.67% vs 271.43% in Mar 2025
Half Yearly Results Snapshot (Standalone) - Sep'25

Growth in half year ended Sep 2025 is 30.79% vs -4.24% in Sep 2024
Growth in half year ended Sep 2025 is 53.66% vs -57.29% in Sep 2024
Nine Monthly Results Snapshot (Standalone) - Dec'25
YoY Growth in nine months ended Dec 2025 is 12.76% vs 30.63% in Dec 2024
YoY Growth in nine months ended Dec 2025 is 79.03% vs -53.03% in Dec 2024
Annual Results Snapshot (Standalone) - Mar'26
YoY Growth in year ended Mar 2026 is 5.02% vs 26.00% in Mar 2025
YoY Growth in year ended Mar 2026 is 11.48% vs 25.77% in Mar 2025
About Danube Industries Ltd

Company Coordinates


