
Compare Danube Industrie with Similar Stocks
Stock DNA
Trading & Distributors
INR 42 Cr (Micro Cap)
32.00
17
0.00%
0.91
3.85%
1.23
Total Returns (Price + Dividend) 
Danube Industrie for the last several years.
Risk Adjusted Returns v/s
Returns Beta

News

Danube Industries Ltd Downgraded to Strong Sell Amid Weak Financials and Bearish Technicals
Danube Industries Ltd, a micro-cap player in the Trading & Distributors sector, has seen its investment rating downgraded from Sell to Strong Sell as of 5 June 2026. This shift reflects deteriorating technical indicators, weakening financial trends, and a reassessment of valuation metrics, signalling heightened risks for investors amid ongoing operational challenges.
Read full news article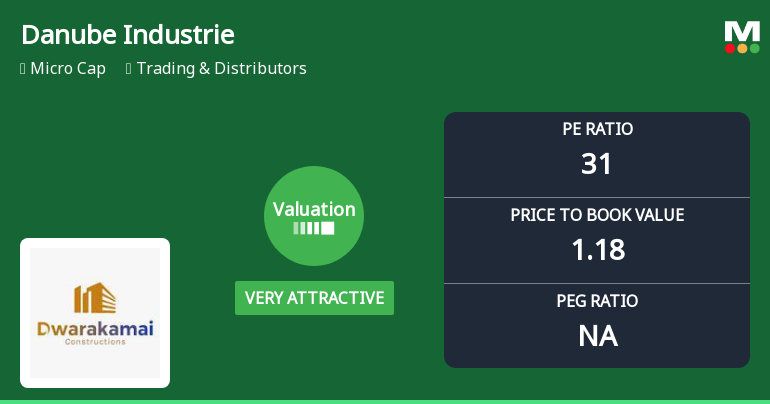
Danube Industries Ltd Valuation Shifts to Very Attractive Amid Market Volatility
Danube Industries Ltd has witnessed a significant recalibration in its valuation parameters, shifting from an attractive to a very attractive price level despite ongoing market headwinds. This development comes amid a sharp decline in the stock price and a deteriorating overall market sentiment, raising important questions about the stock’s future prospects and relative value within the Trading & Distributors sector.
Read full news article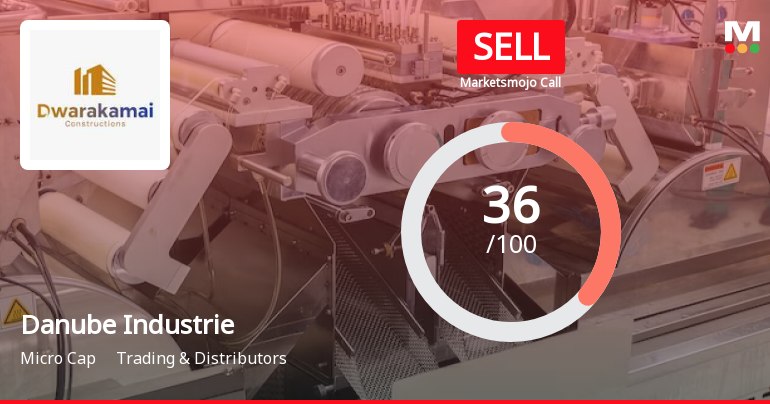
Danube Industries Ltd is Rated Sell
Danube Industries Ltd is rated 'Sell' by MarketsMOJO, with this rating last updated on 08 April 2026. However, the analysis and financial metrics discussed here reflect the stock's current position as of 04 June 2026, providing investors with the latest insights into its performance and outlook.
Read full news article Announcements
Compliances-Reg.24(A)-Annual Secretarial Compliance
30-May-2026 | Source : BSEAttached
Board Meeting Outcome for Outcome Of Board Meeting
18-May-2026 | Source : BSEOutcome of Board Meeting
Result March 2026
18-May-2026 | Source : BSEAttached
Corporate Actions

No Upcoming Board Meetings

No Dividend history available

Danube Industries Ltd has announced 2:10 stock split, ex-date: 15 Feb 22

Danube Industries Ltd has announced 1:1 bonus issue, ex-date: 20 Sep 23

No Rights history available
Quality key factors
Valuation key factors
Technicals key factors
 Technical Indicator Scale: Bearish, Mildly Bearish, Sideways, Mildly Bullish, Bullish Turned
 Shareholding Snapshot : Mar 2026
Shareholding Compare (%holding)
Non Institution
None
Held by 0 Schemes
Held by 0 FIIs
Sunil Hukumat Rajdev (39.47%)
Rameshkumar S Thakkar (4.07%)
56.11%
Quarterly Results Snapshot (Standalone) - Mar'26 - YoY

YoY Growth in quarter ended Mar 2026 is -10.02% vs 17.89% in Mar 2025
YoY Growth in quarter ended Mar 2026 is -56.67% vs 271.43% in Mar 2025
Half Yearly Results Snapshot (Standalone) - Sep'25

Growth in half year ended Sep 2025 is 30.79% vs -4.24% in Sep 2024
Growth in half year ended Sep 2025 is 53.66% vs -57.29% in Sep 2024
Nine Monthly Results Snapshot (Standalone) - Dec'25
YoY Growth in nine months ended Dec 2025 is 12.76% vs 30.63% in Dec 2024
YoY Growth in nine months ended Dec 2025 is 79.03% vs -53.03% in Dec 2024
Annual Results Snapshot (Standalone) - Mar'26
YoY Growth in year ended Mar 2026 is 5.02% vs 26.00% in Mar 2025
YoY Growth in year ended Mar 2026 is 11.48% vs 25.77% in Mar 2025
About Danube Industries Ltd

Company Coordinates


