
Compare Dar Credit & Cap with Similar Stocks
Stock DNA
Non Banking Financial Company (NBFC)
INR 60 Cr (Micro Cap)
6.00
20
1.19%
1.78
9.75%
0.58
Total Returns (Price + Dividend) 
Latest dividend: 0.5 per share ex-dividend date: Nov-21-2025
Risk Adjusted Returns v/s
Returns Beta

News

Dar Credit & Capital Ltd is Rated Sell
Dar Credit & Capital Ltd is rated 'Sell' by MarketsMOJO, with this rating last updated on 05 Aug 2025. However, the analysis and financial metrics discussed here reflect the company’s current position as of 29 May 2026, providing investors with an up-to-date perspective on the stock’s fundamentals, valuation, financial trends, and technical outlook.
Read full news article
Dar Credit & Capital Ltd is Rated Sell
Dar Credit & Capital Ltd is rated 'Sell' by MarketsMOJO, with this rating last updated on 05 Aug 2025. However, the analysis and financial metrics discussed here reflect the company’s current position as of 18 May 2026, providing investors with an up-to-date view of the stock’s fundamentals, valuation, financial trends, and technical outlook.
Read full news article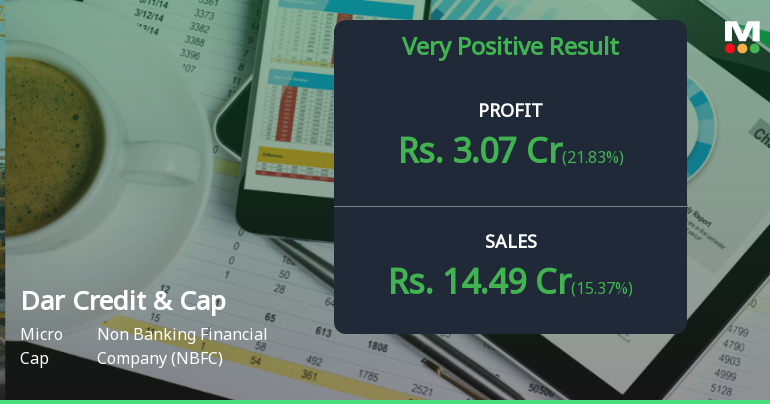
Dar Credit & Capital Q4 FY26: Strong Quarter Masks Structural Concerns
Dar Credit & Capital Ltd., a micro-cap non-banking financial company (NBFC) with a market capitalisation of ₹60.00 crores, reported its strongest quarterly performance in Q4 FY26 with net profit reaching ₹3.07 crores, marking a sequential gain of 21.83% over Q3 FY26 and a substantial 60.73% year-on-year surge. Despite the impressive quarterly numbers, the stock has struggled significantly, declining 25.18% over the past six months and trading 36.52% below its 52-week high of ₹66.00, reflecting persistent investor concerns about the company's modest scale, weak return on equity, and technical deterioration.
Read full news article Announcements
Corporate Actions

No Upcoming Board Meetings

Dar Credit & Capital Ltd has declared 5% dividend, ex-date: 21 Nov 25

No Splits history available

No Bonus history available

No Rights history available
Quality key factors
Valuation key factors
Technicals key factors
 Technical Indicator Scale: Bearish, Mildly Bearish, Sideways, Mildly Bullish, Bullish Turned
 Shareholding Snapshot : Mar 2026
Shareholding Compare (%holding)
Promoters
None
Held by 0 Schemes
Held by 0 FIIs
Ramesh Kumar Vijay (15.91%)
Smc Global Securities Limited (3.82%)
14.21%
Quarterly Results Snapshot (Standalone) - Mar'26 - QoQ

QoQ Growth in quarter ended Mar 2026 is 15.37% vs 5.55% in Dec 2025
QoQ Growth in quarter ended Mar 2026 is 21.83% vs 0.80% in Dec 2025
Half Yearly Results Snapshot (Standalone) - Sep'25
Growth in half year ended Sep 2025 is 12.78% vs 1.05% in Mar 2025
Growth in half year ended Sep 2025 is 21.18% vs 12.35% in Mar 2025
Nine Monthly Results Snapshot (Standalone) - Dec'25
YoY Growth in nine months ended Dec 2025 is 17.68% vs 2.17% in Dec 2024
YoY Growth in nine months ended Dec 2025 is 37.50% vs 10.11% in Dec 2024
Annual Results Snapshot (Standalone) - Mar'26

YoY Growth in year ended Mar 2026 is 23.80% vs 25.08% in Mar 2025
YoY Growth in year ended Mar 2026 is 43.89% vs 90.79% in Mar 2025
About Dar Credit & Capital Ltd

Company Coordinates


