
Compare Darjeeling Indus with Similar Stocks
Stock DNA
Non Banking Financial Company (NBFC)
INR 15 Cr (Micro Cap)
7.00
21
0.00%
0.00
11.68%
1.05
Total Returns (Price + Dividend) 
Latest dividend: 0.2 per share ex-dividend date: Oct-08-2018
Risk Adjusted Returns v/s
Returns Beta

News
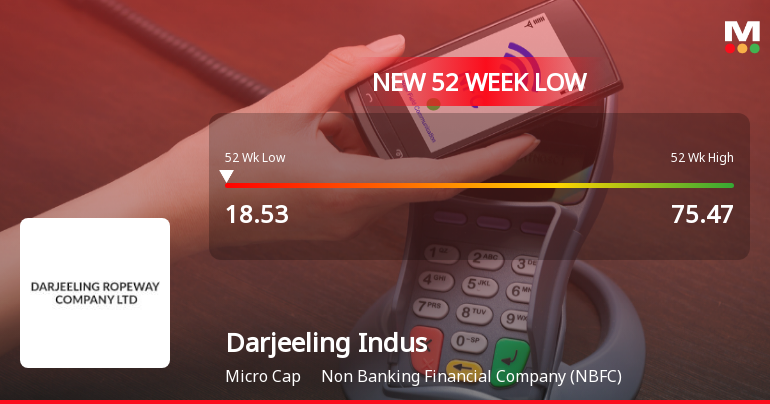
Darjeeling Industriies Ltd Falls to 52-Week Low of Rs 18.53 as Sell-Off Deepens
For the sixteenth consecutive session, Darjeeling Industriies Ltd has closed lower, culminating in a fresh 52-week low of Rs 18.53 on 17 Jul 2026. This sustained decline has wiped out over half of the stock’s value in just over three weeks, underscoring persistent selling pressure despite pockets of positive financial performance.
Read full news article
Darjeeling Industriies Ltd Falls to 52-Week Low of Rs 19.5 as Sell-Off Deepens
For the fifteenth consecutive session, Darjeeling Industriies Ltd has closed lower, culminating in a fresh 52-week low of Rs 19.5 on 16 Jul 2026. This extended decline has erased nearly half the stock’s value over the past three weeks, signalling sustained selling pressure despite a broadly stable market backdrop.
Read full news article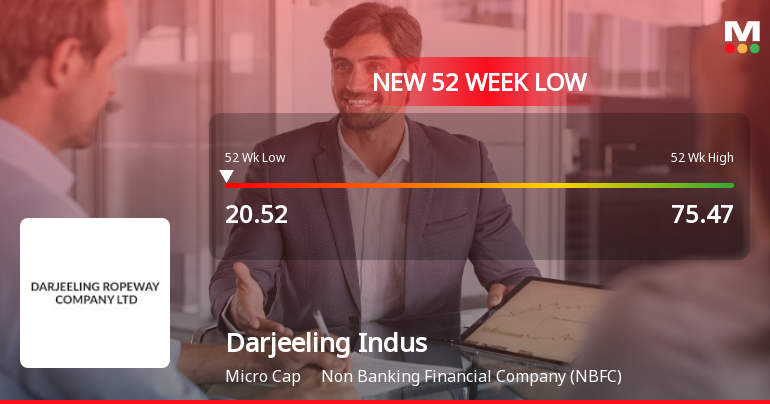
Darjeeling Industriies Ltd Falls to 52-Week Low of Rs 20.52 as Sell-Off Deepens
For the 14th consecutive session, Darjeeling Industriies Ltd has closed lower, culminating in a fresh 52-week low of Rs 20.52 on 15 Jul 2026. This extended decline has wiped out nearly 46% of the stock’s value in just over two weeks, underscoring persistent selling pressure despite some positive financial indicators.
Read full news article Announcements
Clarification sought from Darjeeling Industriies Ltd
15-Jul-2026 | Source : BSEThe Exchange has sought clarification from Darjeeling Industriies Ltd on July 15 2026 with reference to significant movement in price in order to ensure that investors have latest relevant information about the company and to inform the market so that the interest of the investors is safeguarded.
The reply is awaited.
Closure of Trading Window
30-Jun-2026 | Source : BSEIntimation of Closure of Trading Window
Board Meeting Outcome for Outcome Of Board Meeting Held Today I.E. Wednesday 24Th June 2026
24-Jun-2026 | Source : BSEWe hereby inform you that the Board of Directors of the Company at their meeting held today i.e. Wednesday 24th June 2026 at the registered office of the Company which commenced at 03:00 P.M. and concluded at 03:30 P.M. considered and approved the receipt of the 4th tranche of consideration towards the allotment of convertible warrants issued at a price of Rs. 16.80/- per warrant (including a premium of Rs. 6.80/- per warrant) for cash consideration to person(s)/entity(ies) belonging to the Non-Promoter Category on a preferential basis in accordance with the provisions of Chapter V of the SEBI (Issue of Capital and Disclosure Requirements) Regulations 2018.
Corporate Actions

No Upcoming Board Meetings

Darjeeling Industriies Ltd has declared 2% dividend, ex-date: 08 Oct 18

No Splits history available

No Bonus history available

No Rights history available
Quality key factors
Valuation key factors
Technicals key factors
 Technical Indicator Scale: Bearish, Mildly Bearish, Sideways, Mildly Bullish, Bullish Turned
 Shareholding Snapshot : Mar 2026
Shareholding Compare (%holding)
Non Institution
None
Held by 0 Schemes
Held by 1 FIIs (0.49%)
Himanshu Ramniklal Shah (3.22%)
Ashok Dilipkumar Jain (17.18%)
89.78%
Quarterly Results Snapshot (Standalone) - Mar'26 - QoQ

QoQ Growth in quarter ended Mar 2026 is -70.59% vs 119.83% in Dec 2025
QoQ Growth in quarter ended Mar 2026 is -93.33% vs 40.00% in Dec 2025
Half Yearly Results Snapshot (Standalone) - Sep'25

Growth in half year ended Sep 2025 is 27.47% vs 0.00% in Sep 2024
Growth in half year ended Sep 2025 is 176.19% vs 1,150.00% in Sep 2024
Nine Monthly Results Snapshot (Standalone) - Dec'25
YoY Growth in nine months ended Dec 2025 is 307.69% vs 0.00% in Dec 2024
YoY Growth in nine months ended Dec 2025 is 918.75% vs 900.00% in Dec 2024
Annual Results Snapshot (Standalone) - Mar'26
YoY Growth in year ended Mar 2026 is 390.11% vs 0.00% in Mar 2025
YoY Growth in year ended Mar 2026 is 729.63% vs -575.00% in Mar 2025
About Darjeeling Industriies Ltd

Company Coordinates


