
Compare DCM with Similar Stocks
Stock DNA
Computers - Software & Consulting
INR 176 Cr (Micro Cap)
64.00
25
0.00%
-0.57
6.18%
3.92
Total Returns (Price + Dividend) 
Latest dividend: 1.4000 per share ex-dividend date: Nov-20-2015
Risk Adjusted Returns v/s
Returns Beta

News
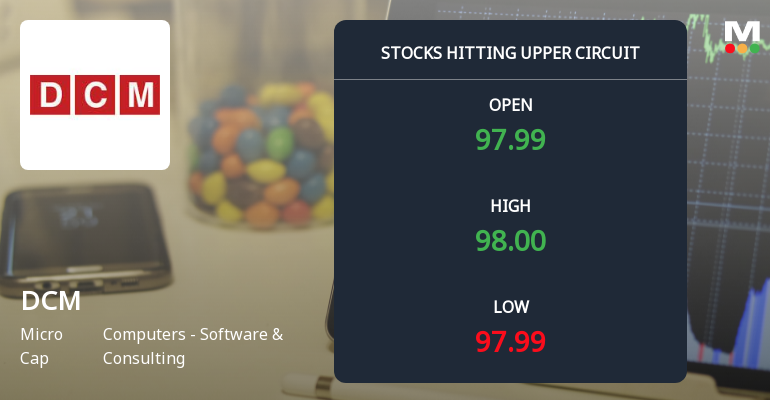
DCM Ltd Locks at Upper Circuit With 5.0% Gain — Buyers Queue, Sellers Absent
At Rs 99.15, the buying was done — not because demand dried up, but because the exchange wouldn't let the stock go any higher. DCM Ltd locked at its upper circuit of 5.0% on 19 Jun 2026, with buyers queuing and no sellers willing to part with shares.
Read full news article
DCM Ltd is Rated Strong Sell
DCM Ltd is rated Strong Sell by MarketsMOJO, with this rating last updated on 12 Jan 2026. However, the analysis and financial metrics discussed here reflect the company’s current position as of 12 June 2026, providing investors with an up-to-date view of the stock’s fundamentals, returns, and technical outlook.
Read full news article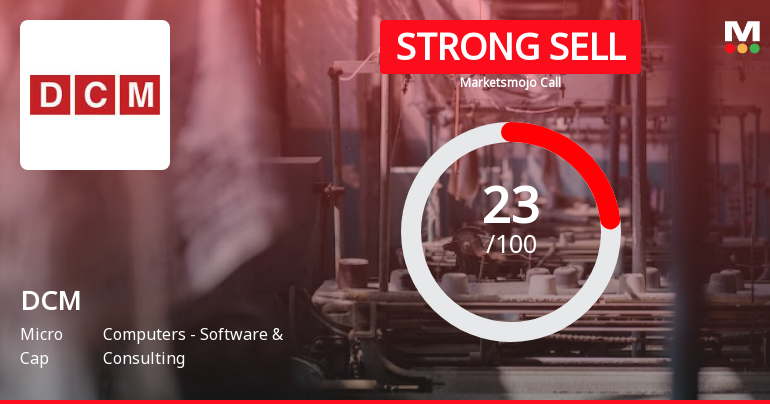
DCM Ltd is Rated Strong Sell
DCM Ltd is rated Strong Sell by MarketsMOJO, with this rating last updated on 12 January 2026. However, the analysis and financial metrics discussed here reflect the company’s current position as of 01 June 2026, providing investors with the latest insights into the stock’s performance and outlook.
Read full news article Announcements
Announcement under Regulation 30 (LODR)-Newspaper Publication
16-Jun-2026 | Source : BSEPlease find enclosed extract of Newspaper Advertisement regarding Notice of Postal Ballot.
Shareholder Meeting / Postal Ballot-Notice of Postal Ballot
15-Jun-2026 | Source : BSEPostal Ballot Notice of the Company is enclosed.
Announcement under Regulation 30 (LODR)-Newspaper Publication
12-Jun-2026 | Source : BSEPlease find enclosed copy of newspaper publication w.r.t. special window for fresh lodgement/re-lodgement of share transfer requests.
Corporate Actions

No Upcoming Board Meetings

DCM Ltd has declared 15% dividend, ex-date: 20 Nov 15

No Splits history available

No Bonus history available

No Rights history available
Quality key factors
Valuation key factors
Technicals key factors
 Technical Indicator Scale: Bearish, Mildly Bearish, Sideways, Mildly Bullish, Bullish Turned
 Shareholding Snapshot : Mar 2026
Shareholding Compare (%holding)
Promoters
None
Held by 4 Schemes (0.02%)
Held by 1 FIIs (0.0%)
Sumant Bharat Ram (28.95%)
Karan Singh Thakral (4.77%)
30.9%
Quarterly Results Snapshot (Consolidated) - Mar'26 - QoQ

QoQ Growth in quarter ended Mar 2026 is 6.73% vs 0.34% in Dec 2025

QoQ Growth in quarter ended Mar 2026 is -403.33% vs -120.69% in Dec 2025
Half Yearly Results Snapshot (Consolidated) - Sep'25
Growth in half year ended Sep 2025 is 0.46% vs -1.74% in Sep 2024
Growth in half year ended Sep 2025 is 1,016.67% vs 132.31% in Sep 2024
Nine Monthly Results Snapshot (Consolidated) - Dec'25
YoY Growth in nine months ended Dec 2025 is 0.95% vs -3.60% in Dec 2024
YoY Growth in nine months ended Dec 2025 is -79.08% vs 1,642.65% in Dec 2024
Annual Results Snapshot (Consolidated) - Mar'26
YoY Growth in year ended Mar 2026 is 3.97% vs -2.54% in Mar 2025
YoY Growth in year ended Mar 2026 is -86.82% vs 321.54% in Mar 2025
About DCM Ltd

Company Coordinates


