
Compare DCM with Similar Stocks
Stock DNA
Computers - Software & Consulting
INR 170 Cr (Micro Cap)
59.00
23
0.00%
-0.57
6.18%
3.65
Total Returns (Price + Dividend) 
Latest dividend: 1.4000 per share ex-dividend date: Nov-20-2015
Risk Adjusted Returns v/s
Returns Beta

News
DCM Ltd is Rated Strong Sell
DCM Ltd is rated Strong Sell by MarketsMOJO, with this rating last updated on 12 January 2026. However, the analysis and financial metrics discussed here reflect the company’s current position as of 01 June 2026, providing investors with the latest insights into the stock’s performance and outlook.
Read full news article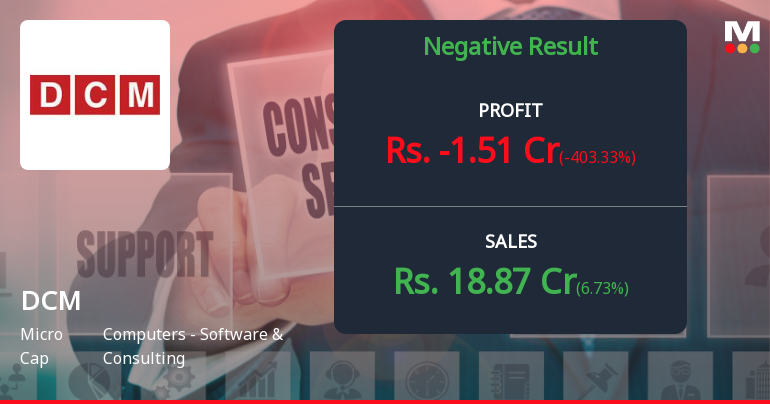
DCM Ltd Q4 FY26: Losses Deepen Despite Revenue Growth as Operational Challenges Mount
DCM Ltd., the micro-cap software and consulting firm with a market capitalisation of ₹161.00 crores, reported deeply disappointing results for Q4 FY26 ended March 2026, with consolidated net profit plunging into negative territory at ₹-1.51 crores compared to ₹0.94 crores in the same quarter last year—a staggering 260.64% year-on-year decline. The stock reacted sharply, falling 5.05% to ₹87.21 in the trading session following the results announcement, underperforming the Sensex which declined 1.44% on the day.
Read full news article
DCM Ltd is Rated Strong Sell
DCM Ltd is rated Strong Sell by MarketsMOJO, with this rating last updated on 12 Jan 2026. However, the analysis and financial metrics discussed here reflect the stock's current position as of 21 May 2026, providing investors with an up-to-date view of the company’s fundamentals, returns, and market standing.
Read full news article Announcements
Announcement under Regulation 30 (LODR)-Newspaper Publication
30-May-2026 | Source : BSEPlease find enclosed extract of newspaper advertisement regarding publication of Audited Financial Results of the company for the Quarter and Financial Year ended on March 31 2026.
Board Meeting Outcome for Submission Of Audited Results
29-May-2026 | Source : BSEsubmission of financial results outcome of board meeting
Board Meeting Intimation for Approving Audited Financial Results For The Quarter And Year Ended March 31 2026
22-May-2026 | Source : BSEDCM Ltdhas informed BSE that the meeting of the Board of Directors of the Company is scheduled on 28/05/2026 inter alia to consider and approve Audited Financial Results for the Quarter and Year ended March 31 2026
Corporate Actions

No Upcoming Board Meetings

DCM Ltd has declared 15% dividend, ex-date: 20 Nov 15

No Splits history available

No Bonus history available

No Rights history available
Quality key factors
Valuation key factors
Technicals key factors
 Technical Indicator Scale: Bearish, Mildly Bearish, Sideways, Mildly Bullish, Bullish Turned
 Shareholding Snapshot : Mar 2026
Shareholding Compare (%holding)
Promoters
None
Held by 4 Schemes (0.02%)
Held by 1 FIIs (0.0%)
Sumant Bharat Ram (28.95%)
Karan Singh Thakral (4.77%)
30.9%
Quarterly Results Snapshot (Consolidated) - Mar'26 - QoQ

QoQ Growth in quarter ended Mar 2026 is 6.73% vs 0.34% in Dec 2025

QoQ Growth in quarter ended Mar 2026 is -403.33% vs -120.69% in Dec 2025
Half Yearly Results Snapshot (Consolidated) - Sep'25
Growth in half year ended Sep 2025 is 0.46% vs -1.74% in Sep 2024
Growth in half year ended Sep 2025 is 1,016.67% vs 132.31% in Sep 2024
Nine Monthly Results Snapshot (Consolidated) - Dec'25
YoY Growth in nine months ended Dec 2025 is 0.95% vs -3.60% in Dec 2024
YoY Growth in nine months ended Dec 2025 is -79.08% vs 1,642.65% in Dec 2024
Annual Results Snapshot (Consolidated) - Mar'26
YoY Growth in year ended Mar 2026 is 3.97% vs -2.54% in Mar 2025
YoY Growth in year ended Mar 2026 is -86.82% vs 321.54% in Mar 2025
About DCM Ltd

Company Coordinates


