
Compare DCM Nouvelle with Similar Stocks
Dashboard
Weak Long Term Fundamental Strength with an average Return on Capital Employed (ROCE) of 3.59%
- Poor long term growth as Net Sales has grown by an annual rate of 5.92% and Operating profit at 6.06% over the last 5 years
- Low ability to service debt as the company has a high Debt to EBITDA ratio of 6.01 times
The company has declared positive results in Mar'2026 after 2 consecutive negative quarters
With ROCE of 3.9, it has a Attractive valuation with a 0.9 Enterprise value to Capital Employed
Majority shareholders : Promoters
Underperformed the market in the last 1 year
Stock DNA
Garments & Apparels
INR 281 Cr (Micro Cap)
51.00
26
0.00%
1.00
1.68%
0.87
Total Returns (Price + Dividend) 
DCM Nouvelle for the last several years.
Risk Adjusted Returns v/s
Returns Beta

News

DCM Nouvelle Ltd is Rated Hold by MarketsMOJO
DCM Nouvelle Ltd is rated 'Hold' by MarketsMOJO, with this rating last updated on 15 June 2026. However, the analysis and financial metrics discussed here reflect the stock's current position as of 14 July 2026, providing investors with an up-to-date view of the company’s fundamentals, returns, and market performance.
Read full news article
DCM Nouvelle Ltd is Rated Hold by MarketsMOJO
DCM Nouvelle Ltd is rated 'Hold' by MarketsMOJO, with this rating last updated on 15 Jun 2026. However, the analysis and financial metrics discussed here reflect the stock's current position as of 03 July 2026, providing investors with an up-to-date view of the company’s fundamentals, valuation, financial trends, and technical outlook.
Read full news article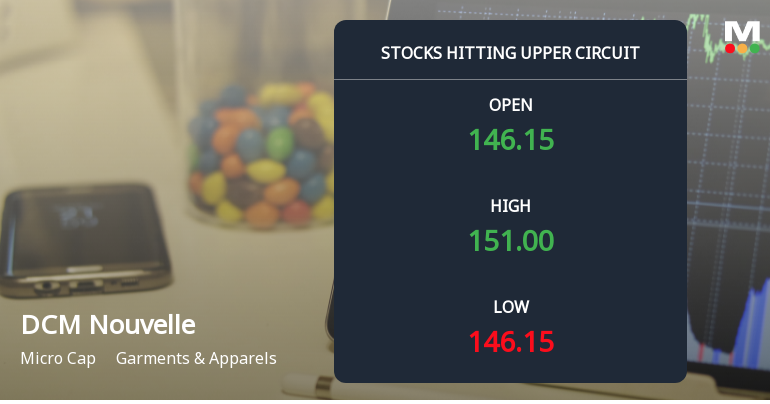
5% Single-Day Gain Locks DCM Nouvelle Ltd at Upper Circuit of Rs 152.79
At Rs 152.79, the buying was done — not because demand dried up, but because the exchange wouldn't let the stock go any higher. DCM Nouvelle Ltd locked at its upper circuit of 5% on 24 Jun 2026, with buyers queuing and no sellers willing to part with shares.
Read full news article Announcements
Compliances-Certificate under Reg. 74 (5) of SEBI (DP) Regulations 2018
10-Jul-2026 | Source : BSECertificate under Regulation 74(5) of SEBI DP Regulations 2018
Closure of Trading Window
22-Jun-2026 | Source : BSEClosure of Trading Window for the quarter ending June 30 2026
Announcement under Regulation 30 (LODR)-Newspaper Publication
06-Jun-2026 | Source : BSENewspaper Publication for Intimation of Special Window for transfer and dematerialisation of physical Shares
Corporate Actions

No Upcoming Board Meetings

No Dividend history available

No Splits history available

No Bonus history available

No Rights history available
Quality key factors
Valuation key factors
Technicals key factors
 Technical Indicator Scale: Bearish, Mildly Bearish, Sideways, Mildly Bullish, Bullish Turned
 Shareholding Snapshot : Mar 2026
Shareholding Compare (%holding)
Promoters
None
Held by 7 Schemes (0.35%)
Held by 2 FIIs (0.55%)
Hemant Bharat Ram (50.11%)
M. G.shares And Stocks Pvt. Ltd. (5.03%)
33.44%
Quarterly Results Snapshot (Consolidated) - Mar'26 - QoQ

QoQ Growth in quarter ended Mar 2026 is -3.48% vs 14.09% in Dec 2025

QoQ Growth in quarter ended Mar 2026 is 501.82% vs 43.59% in Dec 2025
Half Yearly Results Snapshot (Consolidated) - Sep'25
Growth in half year ended Sep 2025 is -7.01% vs -3.85% in Sep 2024
Growth in half year ended Sep 2025 is -94.34% vs 192.09% in Sep 2024
Nine Monthly Results Snapshot (Consolidated) - Dec'25
YoY Growth in nine months ended Dec 2025 is -3.84% vs -2.69% in Dec 2024
YoY Growth in nine months ended Dec 2025 is -123.82% vs 142.18% in Dec 2024
Annual Results Snapshot (Consolidated) - Mar'26
YoY Growth in year ended Mar 2026 is -4.54% vs -0.47% in Mar 2025
YoY Growth in year ended Mar 2026 is -59.48% vs 372.48% in Mar 2025
About DCM Nouvelle Ltd

Company Coordinates


