DCM Shriram

  • Market Cap: Small Cap
  • Industry: Diversified
  • ISIN: INE499A01024
  • NSEID: DCMSHRIRAM
  • BSEID: 523367
INR
1,017.75
8.95 (0.89%)
BSENSE

Aug 07, 03:30 PM

BSE+NSE Vol: 75.78 k

  • Price Points
  • Score
  • Mojo Parameters
  • Total Return
  • News and Corporate Actions
  • Key factors
  • Shareholding
  • Financials
  • CompanyCV
stock-summaryPrice Point
High/Low

1Day

52 Week

Valuation
Technical
Day's Volume

CASH

75.78 k (-8.81%) Volume

Shareholding (Jun 2026)

FII

3.89%

Held by 106 FIIs

DII

8.46%

Held by 9 DIIs

Promoter

66.52%

Why is DCM Shriram Ltd. falling/rising?

07-Aug-2026

As of 06-Aug, DCM Shriram Ltd. is facing a stock price decline to 1,008.80, down 0.7% over the last five days, while underperforming against the Sensex. Despite strong fundamentals and positive quarterly results, the stock is trading below its moving averages, indicating a bearish trend and reduced investor interest.

As of 06-Aug, DCM Shriram Ltd. is experiencing a decline in its stock price, currently at 1,008.80, which reflects a change of -0.7 (-0.07%). The stock has been on a downward trend, having fallen consecutively for the last five days, resulting in a total decline of -4.4% during this period. This negative performance is further highlighted by the stock's underperformance compared to the benchmark Sensex, which has gained +1.32% over the past week.<BR><BR>Additionally, DCM Shriram's stock is trading below its moving averages across various time frames, including the 5-day, 20-day, 50-day, 100-day, and 200-day averages, indicating a bearish trend. The company has also seen a significant drop in investor participation, with delivery volume on 05 August falling by -67.38% compared to the 5-day average, suggesting reduced interest from investors.<BR><BR>Despite these negative indicators, the company has shown strong fundamentals, including high management efficiency and a solid ability to service debt, as evidenced by a low Debt to EBITDA ratio of 1.95 times. Furthermore, DCM Shriram has reported positive results for the last three consecutive quarters, with a notable increase in profits. However, the overall market sentiment and recent stock performance have led to the current decline in price.

View full answer

Are DCM Shriram Ltd. latest results good or bad?

29-Jul-2026

DCM Shriram Ltd.'s latest results show strong profit growth with a net profit of ₹692.75 crores, a 511% increase year-on-year, and a revenue rise of 9.27%. However, concerns arise from declining operating margins and reliance on a one-time tax credit, suggesting potential challenges in sustaining this performance.

DCM Shriram Ltd.'s latest results present a mixed picture. On one hand, the company reported a remarkable net profit of ₹692.75 crores for Q1 FY27, which is a staggering 511% increase year-on-year. Revenue also grew by 9.27% to ₹3,564.24 crores, reflecting a positive trend. The stock reacted positively to these results, gaining 2.15% following the announcement.<BR><BR>However, there are significant concerns regarding the sustainability of this performance. Operating margins have contracted to 9.49%, down from 11.13% in the previous quarter, indicating pressure on profitability. This decline raises questions about the company's ability to maintain its operational performance amidst challenging market conditions. <BR><BR>Moreover, the impressive profit figures were significantly influenced by a one-time tax credit of ₹418.02 crores, which artificially inflated the net profit. Without this extraordinary item, normalized earnings would have been much lower, around ₹180-190 crores, suggesting that the underlying operational performance may not be as strong as the headline figures imply.<BR><BR>In summary, while the results show strong profit growth and revenue increase, the contraction in operating margins and reliance on one-time gains indicate potential challenges ahead. Investors should be cautious and consider these factors when evaluating the company's performance.

View full answer

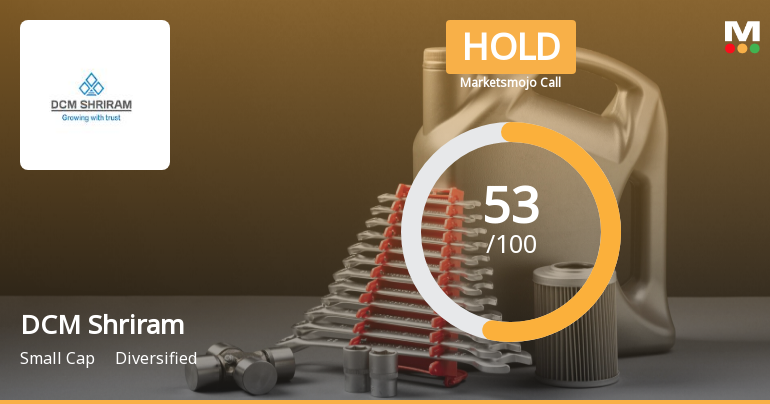
Should I buy, sell or hold DCM Shriram Ltd.?

29-Jul-2026

When is the next results date for DCM Shriram Ltd.?

21-Jul-2026

The next results date for DCM Shriram Ltd. is 28 July 2026.

The next results date for DCM Shriram Ltd. is on 28 July 2026.

View full answer

How big is DCM Shriram?

11-Jun-2026

As of 10th June, DCM Shriram Ltd. has a market capitalization of 16,074.00 Cr, with recent Net Sales of 13,538.15 Cr and a Net Profit of 853.45 Cr.

As of 10th June, DCM Shriram Ltd. has a market capitalization of 16,074.00 Cr, categorizing it as a Small Cap company.<BR><BR>In the latest four quarters, DCM Shriram reported Net Sales of 13,538.15 Cr and a Net Profit of 853.45 Cr.<BR><BR>The latest annual period for the balance sheet is March 2025, with Shareholder's Funds amounting to 7,004.13 Cr and Total Assets of 12,731.14 Cr.

View full answer

Who are in the management team of DCM Shriram?

11-Jun-2026

The management team of DCM Shriram includes Ajay S Shriram (Chairman & Senior Managing Director), Vikram S Shriram (Vice Chairman & Managing Director), Ajit S Shriram (Joint Managing Director), and several other directors, including independent members and a nominee from LIC. Aditya A. Shriram serves as the Deputy Managing Director.

The management team of DCM Shriram includes the following key members:<BR><BR>1. **Ajay S Shriram** - Chairman & Senior Managing Director<BR>2. **Vikram S Shriram** - Vice Chairman & Managing Director<BR>3. **Ajit S Shriram** - Joint Managing Director<BR>4. **K K Kaul** - Whole-time Director<BR>5. **K K Sharma** - Whole-time Director<BR>6. **Sameet Gambhir** - Company Secretary & Compliance Officer<BR><BR>Additionally, the board features several independent directors, including:<BR><BR>- **Pradeep Dinodia**<BR>- **Vimal Bhandari**<BR>- **Sunil Kant Munjal**<BR>- **Ramni Nirula**<BR>- **Vikramajit Sen**<BR>- **Pravesh Sharma**<BR><BR>There is also a nominee from LIC, **Sarita Garg**, and **Aditya A. Shriram** serves as the Deputy Managing Director. This diverse team brings a wealth of experience to the company.

View full answer

Who are the peers of the DCM Shriram?

11-Jun-2026

DCM Shriram's peers include Adani Enterprises, 3M India, Godrej Industries, and others. In terms of management risk, DCM Shriram has a good rating, with a 1-year return of -7.71%, better than Swan Corp's -33.01% but worse than Adani Enterprises' 18.23%.

Peers: The peers of DCM Shriram are Adani Enterp., 3M India, Godrej Industrie, Swan Corp, Sindhu Trade, Balmer Lawrie, TTK Healthcare, Dhunseri Vent., Empire Inds., and Aspinwall & Co.<BR><BR>Quality Snapshot: Excellent management risk is observed at 3M India, while Good management risk is found at DCM Shriram, and Average management risk is present at Swan Corp, Balmer Lawrie, TTK Healthcare, Dhunseri Vent., Empire Inds., and Aspinwall & Co. Excellent growth is noted at Adani Enterp. and Godrej Industrie, while Good growth is seen at 3M India, and Below Average growth is found at DCM Shriram, Swan Corp, Sindhu Trade, TTK Healthcare, Dhunseri Vent., and Empire Inds. Excellent capital structure is exhibited by 3M India, Sindhu Trade, Balmer Lawrie, TTK Healthcare, and DCM Shriram, while Below Average capital structure is noted at Adani Enterp., Godrej Industrie, and Swan Corp.<BR><BR>Return Snapshot: The peer with the highest 1-year return is Adani Enterp. at 18.23%, while the peer with the lowest is Swan Corp at -33.01%. DCM Shriram's 1-year return is -7.71%, which is better than Swan Corp but worse than Adani Enterp. Additionally, several peers including Swan Corp, Godrej Industrie, TTK Healthcare, Dhunseri Vent., and Balmer Lawrie have negative six-month returns.

View full answer

What does DCM Shriram do?

10-Jun-2026

DCM Shriram Ltd. is a diversified small-cap company involved in various industries, including fertilizers and cement. As of March 2026, it reported net sales of ₹3,193 Cr and a net profit of ₹370 Cr, with a market cap of ₹16,074 Cr.

Overview: <BR>DCM Shriram Ltd. operates in the diversified industry as a small-cap company.<BR><BR>History: <BR>DCM Shriram Limited was incorporated on February 6, 1989, as 'DCM Shriram Consolidated Limited' following the restructuring of DCM Limited into four separate entities. The company merged several businesses, including Shriram Fertilizer & Chemicals and Shriram Cement Works. The name was changed to DCM Shriram Limited on February 21, 2014. The latest reported quarter for net sales and profit is March 2026.<BR><BR>Financial Snapshot: <BR>Net Sales: 3,193 Cr (Quarterly Results - Mar 2026) <BR>Net Profit: 370 Cr (Quarterly Results - Mar 2026) <BR>Market Cap: INR 16,074 Cr (Small Cap)<BR><BR>Key Metrics: <BR>P/E: 19.00 <BR>Industry P/E: 93 <BR>Dividend Yield: 1.04% <BR>Debt Equity: 0.26 <BR>Return on Equity: 11.13% <BR>Price to Book: 2.06<BR><BR>Contact Details: <BR>Address: 2nd Floor West Wing, Worldmar 1 Aerocity New Delhi New Delhi : 110037 <BR>Tel: 91-11-23316801/42100200 <BR>Email: response@dcmshriram.com <BR>Website: http://www.dcmshriram.com

View full answer

Has DCM Shriram Ltd. declared dividend?

21-Jan-2026

Yes, DCM Shriram Ltd. has declared a dividend of 180%, amounting to ₹3.6 per share, with an ex-date of January 23, 2026. While recent total returns have shown volatility, longer-term returns have been more favorable.

DCM Shriram Ltd. has declared a dividend.<BR><BR>Dividend Details:<BR>- Percentage announced: 180%<BR>- Amount per share: 3.6<BR>- Ex-date: 23 Jan 26<BR><BR>Dividend Yield: 0.95%<BR><BR>Total Returns by Period:<BR>Over the past 3 months, the price return was -12.01%, the dividend return was 0.59%, resulting in a total return of -11.42%.<BR><BR>In the last 6 months, the price return was -21.0%, the dividend return was 0.76%, leading to a total return of -20.24%.<BR><BR>For the 1-year period, the price return was -1.85%, the dividend return was 0.90%, giving a total return of -0.95%.<BR><BR>Over the 2-year period, the price return was 7.26%, the dividend return was 2.22%, resulting in a total return of 9.48%.<BR><BR>In the 3-year period, the price return was 22.24%, the dividend return was 3.11%, leading to a total return of 25.35%.<BR><BR>For the 4-year period, the price return was 3.73%, the dividend return was 3.77%, resulting in a total return of 7.5%.<BR><BR>Over the 5-year period, the price return was 153.8%, the dividend return was 11.64%, giving a total return of 165.44%.<BR><BR>Overall, DCM Shriram Ltd. has declared a substantial dividend, indicating a commitment to returning value to shareholders. However, the recent total returns over shorter periods show some volatility, with negative returns in the 3-month and 6-month periods, while longer-term returns appear more favorable.

View full answer

Is DCM Shriram technically bullish or bearish?

04-Nov-2025

As of November 3, 2025, DCM Shriram's technical trend is mildly bullish, supported by daily moving averages and monthly indicators, despite mixed signals from weekly MACD and KST.

As of 3 November 2025, the technical trend for DCM Shriram has changed from bullish to mildly bullish. The weekly MACD is mildly bearish, while the monthly MACD remains bullish, indicating mixed signals across time frames. The daily moving averages are bullish, supporting a positive short-term outlook. Bollinger Bands show a sideways trend on the weekly chart but are mildly bullish on the monthly chart. The KST is mildly bearish weekly but bullish monthly, adding to the mixed sentiment. Overall, the current technical stance is mildly bullish, driven by the daily moving averages and monthly indicators, despite some bearish signals on the weekly charts.

View full answer

How has been the historical performance of DCM Shriram?

03-Nov-2025

DCM Shriram has experienced significant growth in net sales and total assets from Mar'19 to Mar'25, but profitability metrics like operating profit and profit before tax have fluctuated. Despite these fluctuations, profit after tax and cash flow from operations have improved, indicating better liquidity management.

Answer:<BR>The historical performance of DCM Shriram shows a mixed trend in financial metrics over the years.<BR><BR>Breakdown:<BR>DCM Shriram's net sales increased from 7,771.14 Cr in Mar'19 to 12,077.35 Cr in Mar'25, reflecting a significant growth trajectory. Total operating income followed a similar pattern, rising from 7,771.14 Cr in Mar'19 to 12,077.35 Cr in Mar'25. However, the operating profit (PBDIT) peaked at 1,888.30 Cr in Mar'22 before declining to 1,472.40 Cr in Mar'25, indicating fluctuations in profitability. The profit before tax also saw a decline from 1,413.13 Cr in Mar'23 to 909.41 Cr in Mar'25. Despite this, profit after tax increased from 447.10 Cr in Mar'24 to 604.27 Cr in Mar'25. The company's total assets grew from 8,078.95 Cr in Mar'20 to 12,731.14 Cr in Mar'25, while total liabilities also increased from 7,789.87 Cr to 12,731.14 Cr in the same period. Cash flow from operating activities improved from 496.00 Cr in Mar'20 to 1,127.00 Cr in Mar'25, and the closing cash and cash equivalents rose from 543.00 Cr in Mar'20 to 619.00 Cr in Mar'25, indicating better liquidity management. Overall, while DCM Shriram has shown growth in sales and assets, profitability metrics have experienced some volatility.

View full answer

Is DCM Shriram overvalued or undervalued?

31-Oct-2025

As of October 30, 2025, DCM Shriram is considered an attractive investment due to its undervalued status, with a PE ratio of 29.04 and strong performance, achieving a one-year return of 26.96%, significantly outpacing the Sensex's 5.58%.

As of 30 October 2025, DCM Shriram's valuation grade has moved from fair to attractive, indicating a positive shift in its market perception. The company is currently deemed undervalued, supported by a PE ratio of 29.04, an EV to EBITDA ratio of 11.27, and a PEG ratio of 0.79, which suggests growth potential relative to its price. <BR><BR>In comparison to its peers, DCM Shriram's valuation appears favorable; for instance, Adani Enterprises is considered expensive with a PE ratio of 85.68, while Tata Chemicals, also attractive, has a PE of 51.71. The company's recent performance has outpaced the Sensex, with a one-year return of 26.96% compared to the Sensex's 5.58%, reinforcing the notion that DCM Shriram is a compelling investment opportunity in its sector.

View full answer

Who are the top shareholders of the DCM Shriram?

06-Jun-2025

The top shareholders of DCM Shriram include Sumant Investments Private Limited with 63.03%, followed by the Life Insurance Corporation of India at 6.22%, and foreign institutional investors at 4.1%. Individual investors hold 8.69%, while mutual funds account for 0.39%, with no pledged promoter holdings reported.

The top shareholders of DCM Shriram include several key players. The largest shareholder is Sumant Investments Private Limited, which holds a significant 63.03% of the company. Following that, the Life Insurance Corporation of India is the highest public shareholder, owning 6.22%. Additionally, foreign institutional investors (FIIs) collectively hold about 4.1%, while mutual funds have a minor stake through 15 schemes, accounting for 0.39%. Individual investors also have a notable presence, holding 8.69% of the shares. Overall, the majority of the shares are held by promoters, with no pledged promoter holdings reported.

View full answer
iScoreScore
Click here to find our call on this stock
Strong Sell
Sell
Hold
Buy
Strong Buy

Dashboard

1

High Management Efficiency with a high ROCE of 15.50%

 
2

Strong ability to service debt as the company has a low Debt to EBITDA ratio of 1.95 times

 
3

Poor long term growth as Operating profit has grown by an annual rate -0.53% of over the last 5 years

 
4

The company has declared Positive results for the last 3 consecutive quarters

5

With ROCE of 10.2, it has a Very Attractive valuation with a 1.8 Enterprise value to Capital Employed

6

Majority shareholders : Promoters

 
7

Below par performance in long term as well as near term

stock-summaryMojo Parameters

Mojo Parameters

Loading Valuation Snapshot...

Stock DNA

stock-summary
Industry

Diversified

stock-summary
Market cap

INR 16,063 Cr (Small Cap)

stock-summary
P/E

12.00

stock-summary
Industry P/E

67

stock-summary
Dividend Yield

1.11%

stock-summary
Debt Equity

0.26

stock-summary
Return on Equity

11.13%

stock-summary
Price to Book

2.04

Revenue and Profits:
Net Sales:
3,564 Cr
(Quarterly Results - Jun 2026)
Net Profit:
693 Cr
stock-summaryTotal Returns
Total Returns (Price + Dividend) stock-summary
Dividend Yield (1.11%)
TimePeriod
Price Return
Dividend Return
Total Return
3 Months
-19.17%
0.33%
-18.84%
6 Months
-12.0%
0.35%
-11.65%
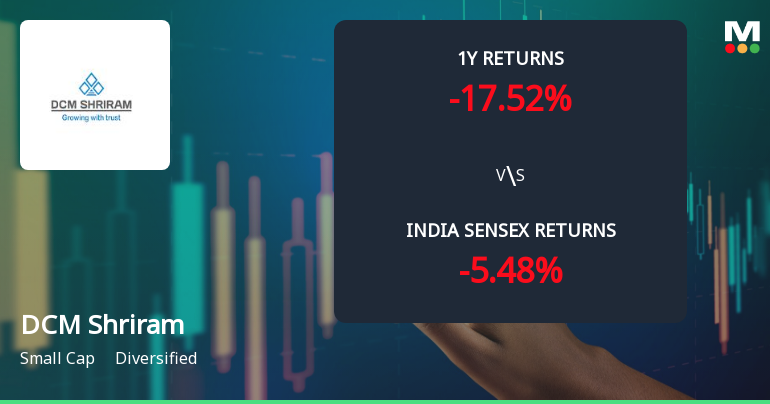
1 Year
-24.27%
0.84%
-23.43%
2 Years
-7.11%
1.77%
-5.34%
3 Years
17.81%
2.99%
20.8%
4 Years
-2.13%
3.95%
1.82%
5 Years
4.71%
6.18%
10.89%

Latest dividend: 4.015145631067962 per share ex-dividend date: Jul-31-2026

Risk Adjusted Returns v/s stock-summary
Returns Beta
Icon
Beta has not been calculated since enough price history is not available
stock-summaryNews & Corporate Actions

News

DCM Shriram Gains 2.83%: Key Earnings and Technical Shifts Shape Week

Announcements stock-summary

Announcement under Regulation 30 (LODR)-Earnings Call Transcript

05-Aug-2026 | Source : BSE

Earning Call Transcript for Q1 FY 27 is attached herewith

Announcement under Regulation 30 (LODR)-Analyst / Investor Meet - Outcome

30-Jul-2026 | Source : BSE

Audio Recording link for Analyst Call held on 30.07.2026 is attached

Announcement under Regulation 30 (LODR)-Newspaper Publication

29-Jul-2026 | Source : BSE

Newspaper Publication

Corporate Actions stock-summary

stock-summary
BOARD MEETING

No Upcoming Board Meetings

stock-summary
DIVIDEND

DCM Shriram Ltd. has declared 200% dividend, ex-date: 31 Jul 26

stock-summary
SPLITS

No Splits history available

stock-summary
BONUS

No Bonus history available

stock-summary
RIGHTS

No Rights history available

stock-summaryKey Factors

Quality key factors stock-summary

Factor
Value
Sales Growth (5y)
10.63%
EBIT Growth (5y)
-0.53%
EBIT to Interest (avg)
12.00
Debt to EBITDA (avg)
1.45
Net Debt to Equity (avg)
0.26
Sales to Capital Employed (avg)
1.36
Tax Ratio
Tax Ratio is Negative%
Dividend Payout Ratio
20.57%
Pledged Shares
0
Institutional Holding
12.35%
ROCE (avg)
17.20%
ROE (avg)
12.14%

Valuation key factors

Factor
Value
P/E Ratio
12
Industry P/E
67
Price to Book Value
2.06
EV to EBIT
17.67
EV to EBITDA
11.68
EV to Capital Employed
1.84
EV to Sales
1.29
PEG Ratio
0.10
Dividend Yield
1.10%
ROCE (Latest)
10.24%
ROE (Latest)
11.13%

Technicals key factors

Indicator
Weekly
Monthly
MACD
Bearish
Mildly Bearish
RSI
No Signal
No Signal
Bollinger Bands
Bearish
Bearish
Moving Averages
Bearish (Daily)
KST
Bearish
Mildly Bearish
Dow Theory
Mildly Bullish
No Trend
OBV
No Trend
No Trend
stock-summary Technical Indicator Scale: Bearish, Mildly Bearish, Sideways, Mildly Bullish, Bullish  Turned 
stock-summaryShareholding
Shareholding Snapshot : Jun 2026stock-summary
Shareholding Compare (%holding) stock-summary
Majority shareholders

Promoters

Pledged Promoter Holdings

None

Mutual Funds

Held by 20 Schemes (1.3%)

FIIs

Held by 106 FIIs (3.89%)

Promoter with highest holding

Sumant Investments Private Limited (63.03%)

Highest Public shareholder

Life Insurance Corporation Of India (6.01%)

Individual Investors Holdings

8.35%

stock-summaryFinancial
[
  {
    "link": "quarterly",
    "btn_text": "All Quarterly Results",
    "header": "Quarterly Results Snapshot (Consolidated) - Jun'26 - QoQ",
    "rhs": [
      {
        "prefix": "Net Sales ",
        "suffix": "QoQ Growth in quarter ended Jun 2026 is 11.61% vs -16.21% in Mar 2026",
        "dir": 1
      },
      {
        "prefix": "Consolidated Net Profit ",
        "suffix": "QoQ Growth in quarter ended Jun 2026 is 87.27% vs 74.40% in Mar 2026",
        "dir": 1
      }
    ],
    "table": {
      "header": [
        "Jun'26",
        "Mar'26",
        "Change(%)"
      ],
      "body": [
        {
          "field": "Net Sales",
          "val1": "3,564.24",
          "val2": "3,193.34",
          "chgp": "11.61%",
          "chgp_class": "positive"
        },
        {
          "field": "Operating Profit (PBDIT) excl Other Income",
          "val1": "336.56",
          "val2": "353.08",
          "chgp": "-4.68%",
          "chgp_class": "negative"
        },
        {
          "field": "Interest",
          "val1": "41.09",
          "val2": "39.66",
          "chgp": "3.61%",
          "chgp_class": "negative"
        },
        {
          "field": "Exceptional Items",
          "val1": "79.42",
          "val2": "31.61",
          "chgp": "151.25%",
          "chgp_class": "positive"
        },
        {
          "field": "Consolidate Net Profit",
          "val1": "692.75",
          "val2": "369.92",
          "chgp": "87.27%",
          "chgp_class": "positive"
        },
        {
          "field": "Operating Profit Margin (Excl OI)",
          "val1": "9.49%",
          "val2": "11.13%",
          "chgp": "-1.64%",
          "chgp_class": "negative"
        }
      ]
    }
  },
  {
    "link": "half-yearly",
    "btn_text": "All Half Yearly Results",
    "header": "Half Yearly Results Snapshot (Consolidated) - Sep'25",
    "rhs": [
      {
        "prefix": "Net Sales ",
        "suffix": " Growth in half year ended Sep 2025 is 12.00% vs 6.30% in Sep 2024",
        "dir": 1
      },
      {
        "prefix": "Consolidated Net Profit ",
        "suffix": " Growth in half year ended Sep 2025 is 66.29% vs 83.76% in Sep 2024",
        "dir": -1
      }
    ],
    "table": {
      "header": [
        "Sep'25",
        "Sep'24",
        "Change(%)"
      ],
      "body": [
        {
          "field": "Net Sales",
          "val1": "6,533.59",
          "val2": "5,833.78",
          "chgp": "12.00%",
          "chgp_class": "positive"
        },
        {
          "field": "Operating Profit (PBDIT) excl Other Income",
          "val1": "612.61",
          "val2": "429.04",
          "chgp": "42.79%",
          "chgp_class": "positive"
        },
        {
          "field": "Interest",
          "val1": "87.11",
          "val2": "67.50",
          "chgp": "29.05%",
          "chgp_class": "negative"
        },
        {
          "field": "Exceptional Items",
          "val1": "0.00",
          "val2": "0.00",
          "chgp": "",
          "chgp_class": "neutral"
        },
        {
          "field": "Consolidate Net Profit",
          "val1": "271.42",
          "val2": "163.22",
          "chgp": "66.29%",
          "chgp_class": "positive"
        },
        {
          "field": "Operating Profit Margin (Excl OI)",
          "val1": "9.42%",
          "val2": "7.39%",
          "chgp": "2.03%",
          "chgp_class": "positive"
        }
      ]
    }
  },
  {
    "link": "nine-monthly",
    "btn_text": "All Nine Monthly Results",
    "header": "Nine Monthly Results Snapshot (Consolidated) - Dec'25",
    "rhs": [
      {
        "prefix": "Net Sales ",
        "suffix": "YoY Growth in nine months ended Dec 2025 is 12.44% vs 7.95% in Dec 2024",
        "dir": 1
      },
      {
        "prefix": "Consolidated Net Profit ",
        "suffix": "YoY Growth in nine months ended Dec 2025 is 13.68% vs 29.17% in Dec 2024",
        "dir": -1
      }
    ],
    "table": {
      "header": [
        "Dec'25",
        "Dec'24",
        "Change(%)"
      ],
      "body": [
        {
          "field": "Net Sales",
          "val1": "10,344.81",
          "val2": "9,200.59",
          "chgp": "12.44%",
          "chgp_class": "positive"
        },
        {
          "field": "Operating Profit (PBDIT) excl Other Income",
          "val1": "1,144.26",
          "val2": "925.03",
          "chgp": "23.70%",
          "chgp_class": "positive"
        },
        {
          "field": "Interest",
          "val1": "136.00",
          "val2": "110.27",
          "chgp": "23.33%",
          "chgp_class": "negative"
        },
        {
          "field": "Exceptional Items",
          "val1": "-55.00",
          "val2": "0.00",
          "chgp": "",
          "chgp_class": "neutral"
        },
        {
          "field": "Consolidate Net Profit",
          "val1": "483.53",
          "val2": "425.36",
          "chgp": "13.68%",
          "chgp_class": "positive"
        },
        {
          "field": "Operating Profit Margin (Excl OI)",
          "val1": "11.06%",
          "val2": "10.05%",
          "chgp": "1.01%",
          "chgp_class": "positive"
        }
      ]
    }
  },
  {
    "link": "annual",
    "btn_text": "All Annual Results",
    "header": "Annual Results Snapshot (Consolidated) - Mar'26",
    "rhs": [
      {
        "prefix": "Net Sales ",
        "suffix": "YoY Growth in year ended Mar 2026 is 12.10% vs 10.57% in Mar 2025",
        "dir": 1
      },
      {
        "prefix": "Consolidated Net Profit ",
        "suffix": "YoY Growth in year ended Mar 2026 is 41.23% vs 35.15% in Mar 2025",
        "dir": 1
      }
    ],
    "table": {
      "header": [
        "Mar'26",
        "Mar'25",
        "Change(%)"
      ],
      "body": [
        {
          "field": "Net Sales",
          "val1": "13,538.15",
          "val2": "12,077.35",
          "chgp": "12.10%",
          "chgp_class": "positive"
        },
        {
          "field": "Operating Profit (PBDIT) excl Other Income",
          "val1": "1,497.34",
          "val2": "1,330.26",
          "chgp": "12.56%",
          "chgp_class": "positive"
        },
        {
          "field": "Interest",
          "val1": "175.66",
          "val2": "152.82",
          "chgp": "14.95%",
          "chgp_class": "negative"
        },
        {
          "field": "Exceptional Items",
          "val1": "-23.39",
          "val2": "0.00",
          "chgp": "",
          "chgp_class": "neutral"
        },
        {
          "field": "Consolidate Net Profit",
          "val1": "853.44",
          "val2": "604.27",
          "chgp": "41.23%",
          "chgp_class": "positive"
        },
        {
          "field": "Operating Profit Margin (Excl OI)",
          "val1": "11.12%",
          "val2": "11.09%",
          "chgp": "0.03%",
          "chgp_class": "positive"
        }
      ]
    }
  }
]

Quarterly Results Snapshot (Consolidated) - Jun'26 - QoQstock-summary

Jun'26
Mar'26
Change(%)
Net Sales
3,564.24
3,193.34
11.61%
Operating Profit (PBDIT) excl Other Income
336.56
353.08
-4.68%
Interest
41.09
39.66
3.61%
Exceptional Items
79.42
31.61
151.25%
Consolidate Net Profit
692.75
369.92
87.27%
Operating Profit Margin (Excl OI)
9.49%
11.13%
-1.64%
Values in Rs Cr.
Direction Arrows
Net Sales

QoQ Growth in quarter ended Jun 2026 is 11.61% vs -16.21% in Mar 2026

Direction Arrows
Consolidated Net Profit

QoQ Growth in quarter ended Jun 2026 is 87.27% vs 74.40% in Mar 2026

Half Yearly Results Snapshot (Consolidated) - Sep'25stock-summary

Sep'25
Sep'24
Change(%)
Net Sales
6,533.59
5,833.78
12.00%
Operating Profit (PBDIT) excl Other Income
612.61
429.04
42.79%
Interest
87.11
67.50
29.05%
Exceptional Items
0.00
0.00
Consolidate Net Profit
271.42
163.22
66.29%
Operating Profit Margin (Excl OI)
9.42%
7.39%
2.03%
Values in Rs Cr.
Direction Arrows
Net Sales

Growth in half year ended Sep 2025 is 12.00% vs 6.30% in Sep 2024

Direction Arrows
Consolidated Net Profit

Growth in half year ended Sep 2025 is 66.29% vs 83.76% in Sep 2024

Nine Monthly Results Snapshot (Consolidated) - Dec'25stock-summary

Dec'25
Dec'24
Change(%)
Net Sales
10,344.81
9,200.59
12.44%
Operating Profit (PBDIT) excl Other Income
1,144.26
925.03
23.70%
Interest
136.00
110.27
23.33%
Exceptional Items
-55.00
0.00
Consolidate Net Profit
483.53
425.36
13.68%
Operating Profit Margin (Excl OI)
11.06%
10.05%
1.01%
Values in Rs Cr.
Direction Arrows
Net Sales

YoY Growth in nine months ended Dec 2025 is 12.44% vs 7.95% in Dec 2024

Direction Arrows
Consolidated Net Profit

YoY Growth in nine months ended Dec 2025 is 13.68% vs 29.17% in Dec 2024

Annual Results Snapshot (Consolidated) - Mar'26stock-summary

Mar'26
Mar'25
Change(%)
Net Sales
13,538.15
12,077.35
12.10%
Operating Profit (PBDIT) excl Other Income
1,497.34
1,330.26
12.56%
Interest
175.66
152.82
14.95%
Exceptional Items
-23.39
0.00
Consolidate Net Profit
853.44
604.27
41.23%
Operating Profit Margin (Excl OI)
11.12%
11.09%
0.03%
Values in Rs Cr.
Direction Arrows
Net Sales

YoY Growth in year ended Mar 2026 is 12.10% vs 10.57% in Mar 2025

Direction Arrows
Consolidated Net Profit

YoY Growth in year ended Mar 2026 is 41.23% vs 35.15% in Mar 2025

stock-summaryCompany CV
About DCM Shriram Ltd. stock-summary
stock-summary
DCM Shriram Ltd.
Small Cap
Diversified
DCM Shriram Limited was initially established as 'DCM Shriram Consolidated Limited' on February 6, 1989 when DCM Limited was restructured into four separate companies. The Company took over one third of the businesses of DCM Ltd by merging, Shriram Fertilizer & Chemicals, Shriram Cement Works, Seatantra Bharat Mills and DCM Silk Mills. The name of the Company was changed from DCM Shriram Consolidated Limited to DCM Shriram Limited w.e.f. 21st February 2014.
Company Coordinates stock-summary
Company Details
2nd Floor West Wing, Worldmar 1 Aerocity New Delhi New Delhi : 110037
stock-summary
Tel: 91-11-23316801/42100200
stock-summary
response@dcmshriram.com
Registrar Details
MCS Ltd , F-65, , Okhla Industrial Area, Phase - I, New Delhi