
Compare DCM Shriram Fine with Similar Stocks
Dashboard
With a Operating Losses, the company has a Weak Long Term Fundamental Strength
- The company has reported losses. Due to this company has reported negative ROE
- PBT LESS OI(Q) At Rs -5.25 cr has Fallen at -1678.9% (vs previous 4Q average)
- PAT(Q) At Rs -4.08 cr has Fallen at -866.2% (vs previous 4Q average)
- NET SALES(Q) At Rs 93.08 cr has Fallen at -7.0% (vs previous 4Q average)
Risky - Negative Operating Profits
Falling Participation by Institutional Investors
Stock DNA
Commodity Chemicals
INR 207 Cr (Micro Cap)
NA (Loss Making)
46
1.67%
-0.21
-2.14%
1.04
Total Returns (Price + Dividend) 
Latest dividend: 0.4006896551724138 per share ex-dividend date: Jul-01-2026
Risk Adjusted Returns v/s
Returns Beta

News
DCM Shriram Fine Chemicals Ltd is Rated Strong Sell
DCM Shriram Fine Chemicals Ltd is rated Strong Sell by MarketsMOJO. This rating was last updated on 20 May 2026. However, all fundamentals, returns, and financial metrics discussed here reflect the company’s current position as of 04 July 2026, providing investors with the latest insight into the stock’s performance and outlook.
Read full news article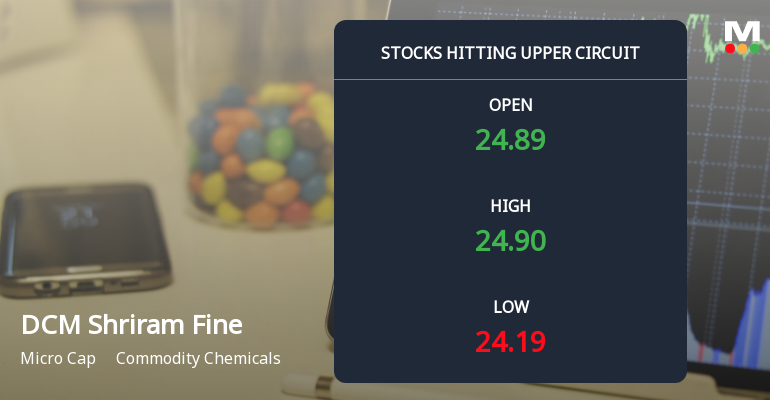
DCM Shriram Fine Chemicals Ltd Locks at Upper Circuit With 5% Gain — Buyers Queue, Sellers Absent
At Rs 24.78, the buying was done — not because demand dried up, but because the exchange wouldn't let the stock go any higher. DCM Shriram Fine Chemicals Ltd locked at its upper circuit of 5% on 1 Jul 2026, with buyers queuing and no sellers willing to part with shares.
Read full news article
DCM Shriram Fine Chemicals Ltd is Rated Strong Sell
DCM Shriram Fine Chemicals Ltd is rated Strong Sell by MarketsMOJO. This rating was last updated on 20 May 2026. However, the analysis and financial metrics discussed below reflect the company’s current position as of 23 June 2026, providing investors with the latest insights into the stock’s fundamentals, valuation, financial trend, and technical outlook.
Read full news article Announcements
Closure of Trading Window
25-Jun-2026 | Source : BSEClosure of Trading Window for the declaration of Un-audited Financial Results for the quarter ending 30th June 2026.
Intimation Of Dispatch Of Annual Report Notice To Shareholders_5Th AGM
23-Jun-2026 | Source : BSEThe Company has completed the dispatch of physical letter to shareholders pursuant to Reg 36(1)(b) of SEBI (LODR) Regulations 2015
Announcement Under Regulation (30 LODR) - Newspaper Publication
22-Jun-2026 | Source : BSENewspaper publication - 5th AGM Notice
Corporate Actions

No Upcoming Board Meetings

DCM Shriram Fine Chemicals Ltd has declared 20% dividend, ex-date: 01 Jul 26

No Splits history available

No Bonus history available

No Rights history available
Quality key factors
Valuation key factors
Technicals key factors
 Technical Indicator Scale: Bearish, Mildly Bearish, Sideways, Mildly Bullish, Bullish Turned
 Shareholding Snapshot : Mar 2026
Shareholding Compare (%holding)
Promoters
None
Held by 2 Schemes (0.0%)
Held by 36 FIIs (1.48%)
Lala Bansi Dhar & Sons (13.83%)
Life Insurance Corporation Of India (4.64%)
25.61%
Quarterly Results Snapshot (Standalone) - Mar'26 - QoQ

QoQ Growth in quarter ended Mar 2026 is -3.68% vs -0.22% in Dec 2025
QoQ Growth in quarter ended Mar 2026 is -151.85% vs 40.44% in Dec 2025
Annual Results Snapshot (Standalone) - Mar'26
Not Applicable: The company has declared_date for only one period
Not Applicable: The company has declared_date for only one period
About DCM Shriram Fine Chemicals Ltd

Company Coordinates


