
Compare DCM Shriram Intl with Similar Stocks
Stock DNA
Aerospace & Defense
INR Cr (Micro Cap)
56.00
NA
0.00%
0.00
0.00%
0.00
Total Returns (Price + Dividend) 
Latest dividend: 0.4 per share ex-dividend date: Jul-06-2026
Risk Adjusted Returns v/s
Returns Beta

News

DCM Shriram International Ltd is Rated Sell
DCM Shriram International Ltd is rated 'Sell' by MarketsMOJO, with this rating last updated on 22 June 2026. However, the analysis and financial metrics discussed here reflect the stock's current position as of 18 July 2026, providing investors with the latest insights into the company’s performance and outlook.
Read full news article
DCM Shriram International Ltd Technical Momentum Shifts Amid Mixed Market Returns
Shares of DCM Shriram International Ltd have exhibited a notable shift in technical momentum, transitioning from a sideways trend to a mildly bullish stance. This change is underscored by key technical indicators such as the MACD, RSI, Bollinger Bands, and moving averages, signalling a potential uptrend in the Aerospace & Defense sector stock.
Read full news article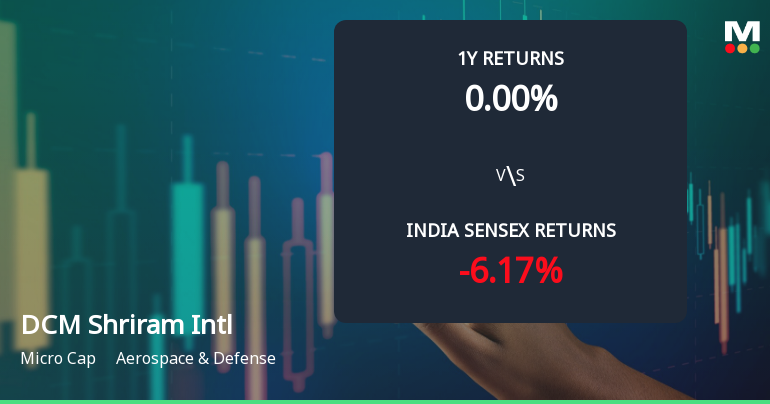
DCM Shriram International Ltd Technical Momentum Shifts Amid Sideways Trend
Shares of DCM Shriram International Ltd have exhibited a notable shift in technical momentum, transitioning from a mildly bullish stance to a sideways trend. This change comes amid mixed signals from key technical indicators such as MACD, RSI, and moving averages, raising questions about the stock’s near-term trajectory within the Aerospace & Defense sector.
Read full news article Announcements
Corporate Actions

No Upcoming Board Meetings

DCM Shriram International Ltd has declared 20% dividend, ex-date: 06 Jul 26

No Splits history available

No Bonus history available

No Rights history available
Quality key factors
Valuation key factors
Technicals key factors
 Technical Indicator Scale: Bearish, Mildly Bearish, Sideways, Mildly Bullish, Bullish Turned
 Shareholding Snapshot : Mar 2026
Shareholding Compare (%holding)
Promoters
None
Held by 2 Schemes (0.0%)
Held by 36 FIIs (1.49%)
Lala Bansi Dhar & Sons (13.83%)
Life Insurance Corporation Of India (4.64%)
18.96%
Quarterly Results Snapshot (Standalone) - Mar'26 - QoQ

QoQ Growth in quarter ended Mar 2026 is -1.44% vs 15.97% in Dec 2025
QoQ Growth in quarter ended Mar 2026 is -517.18% vs 242.34% in Dec 2025
Annual Results Snapshot (Standalone) - Mar'26
Not Applicable: The company has declared_date for only one period
Not Applicable: The company has declared_date for only one period
About DCM Shriram International Ltd

Company Coordinates


