
Compare DCW with Similar Stocks
Dashboard
Weak Long Term Fundamental Strength with a -0.71% CAGR growth in Operating Profits over the last 5 years
- Company's ability to service its debt is weak with a poor EBIT to Interest (avg) ratio of 1.83
- The company has been able to generate a Return on Equity (avg) of 7.27% signifying low profitability per unit of shareholders funds
Falling Participation by Institutional Investors
Underperformed the market in the last 1 year
Stock DNA
Petrochemicals
INR 1,361 Cr (Small Cap)
29.00
41
0.44%
0.08
4.48%
1.24
Total Returns (Price + Dividend) 
Latest dividend: 0.1 per share ex-dividend date: Feb-20-2026
Risk Adjusted Returns v/s
Returns Beta

News

DCW Ltd Downgraded to Strong Sell Amid Valuation and Financial Concerns
DCW Ltd, a small-cap player in the petrochemicals sector, has seen its investment rating downgraded from Sell to Strong Sell as of 9 June 2026. This revision reflects a combination of deteriorating valuation metrics, subdued financial trends, weak quality scores, and unfavourable technical indicators, signalling caution for investors amid challenging market conditions.
Read full news article
DCW Ltd is Rated Sell by MarketsMOJO
DCW Ltd is rated 'Sell' by MarketsMOJO, with this rating last updated on 01 June 2026. However, the analysis and financial metrics discussed here reflect the stock's current position as of 09 June 2026, providing investors with an up-to-date view of the company’s fundamentals, returns, and market performance.
Read full news article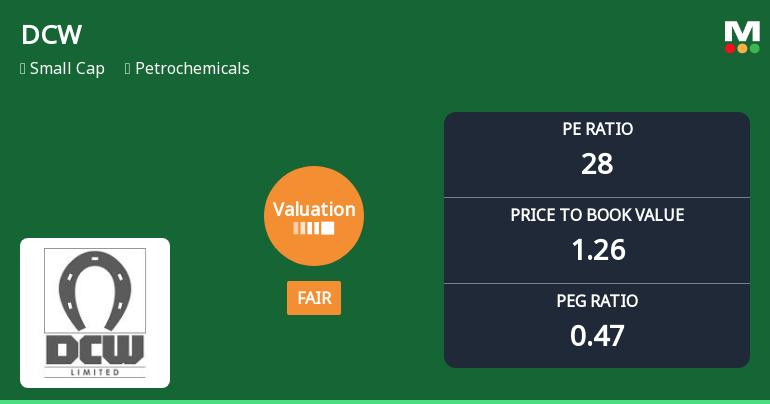
DCW Ltd Valuation Shifts Signal Improved Price Attractiveness Amid Sector Challenges
DCW Ltd, a small-cap player in the petrochemicals sector, has witnessed a notable shift in its valuation parameters, moving from an expensive to a fair valuation grade. Despite recent share price declines and sector headwinds, this adjustment in price-to-earnings and price-to-book ratios suggests a more attractive entry point for investors, although caution remains warranted given the company’s middling financial returns and peer comparisons.
Read full news article Announcements
Email And Letters Sent To Shareholders Regarding Second 100 DAYS CAMPAIGN- SAKSHAM NIVESHAK
03-Jun-2026 | Source : BSEPlease refer attachment
Report Of Audit Committee And Independent Directors Of The Company Certifying Distribution Of Proceeds To Eligible Shareholders Of Fractional Shares Pursuant To Scheme Of Amalgamation
29-May-2026 | Source : BSEReport of Audit Committee and Independent Directors
Announcement under Regulation 30 (LODR)-Newspaper Publication
25-May-2026 | Source : BSENewspaper Publication regarding Second 100 days campaign Saksham Niveshak
Corporate Actions

No Upcoming Board Meetings

DCW Ltd has declared 5% dividend, ex-date: 20 Feb 26

No Splits history available

No Bonus history available

No Rights history available
Quality key factors
Valuation key factors
Technicals key factors
 Technical Indicator Scale: Bearish, Mildly Bearish, Sideways, Mildly Bullish, Bullish Turned
 Shareholding Snapshot : Feb 2026
Shareholding Compare (%holding)
Non Institution
3.8476
Held by 6 Schemes (0.0%)
Held by 45 FIIs (8.17%)
Ashish Jain (10.97%)
Eriska Investment Fund Ltd (2.77%)
31.08%
Quarterly Results Snapshot (Standalone) - Mar'26 - QoQ

QoQ Growth in quarter ended Mar 2026 is 17.17% vs -3.60% in Dec 2025
QoQ Growth in quarter ended Mar 2026 is 268.98% vs -64.52% in Dec 2025
Half Yearly Results Snapshot (Standalone) - Sep'25

Growth in half year ended Sep 2025 is 2.68% vs 15.98% in Sep 2024
Growth in half year ended Sep 2025 is 359.85% vs -56.68% in Sep 2024
Nine Monthly Results Snapshot (Standalone) - Dec'25
YoY Growth in nine months ended Dec 2025 is 4.93% vs 17.00% in Dec 2024
YoY Growth in nine months ended Dec 2025 is 59.26% vs 5,627.27% in Dec 2024
Annual Results Snapshot (Standalone) - Mar'26
YoY Growth in year ended Mar 2026 is 7.16% vs 6.88% in Mar 2025
YoY Growth in year ended Mar 2026 is 60.19% vs 92.02% in Mar 2025
About DCW Ltd

Company Coordinates


