
Compare DCX Systems with Similar Stocks
Dashboard
With a Operating Losses, the company has a Weak Long Term Fundamental Strength
- Company's ability to service its debt is weak with a poor EBIT to Interest (avg) ratio of -1.09
- The company has been able to generate a Return on Equity (avg) of 3.18% signifying low profitability per unit of shareholders funds
With a fall in PBT of -61.23%, the company declared Very Negative results in Mar 26
Risky - Negative EBITDA
Stock DNA
Aerospace & Defense
INR 2,013 Cr (Small Cap)
NA (Loss Making)
54
0.00%
-0.50
-0.51%
1.32
Total Returns (Price + Dividend) 
DCX Systems for the last several years.
Risk Adjusted Returns v/s
Returns Beta

News
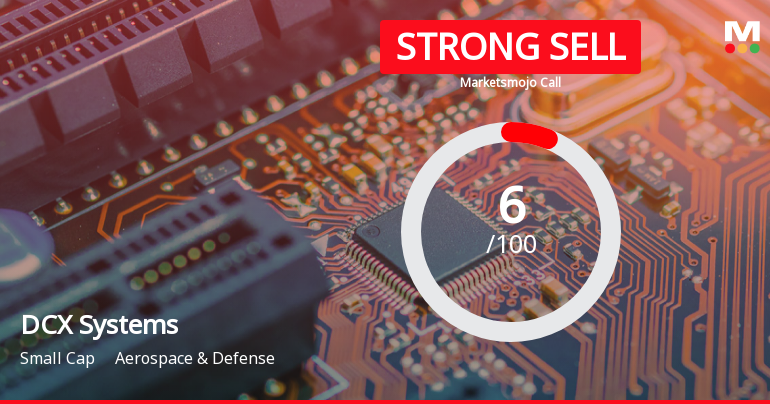
DCX Systems Ltd is Rated Strong Sell
DCX Systems Ltd is rated Strong Sell by MarketsMOJO. This rating was last updated on 03 Jun 2025, reflecting a significant reassessment of the stock’s outlook. However, the analysis and financial metrics discussed below represent the company’s current position as of 28 July 2026, providing investors with the latest insights into its performance and prospects.
Read full news article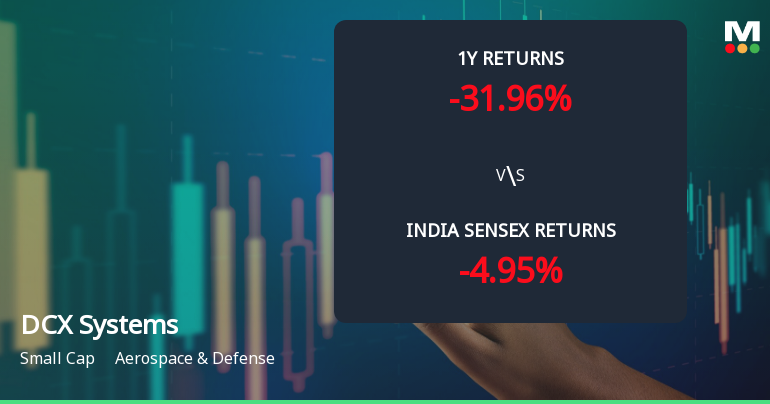
DCX Systems Ltd Faces Technical Momentum Shift Amid Bearish Signals
DCX Systems Ltd, a small-cap player in the Aerospace & Defense sector, has experienced a notable shift in its technical momentum, moving from a mildly bullish to a mildly bearish trend. This transition is underscored by a series of mixed technical indicator signals, including bearish MACD and Bollinger Bands on weekly and monthly charts, alongside a modestly bullish daily moving average. Investors are advised to carefully analyse these developments amid the company’s recent price performance and broader market context.
Read full news article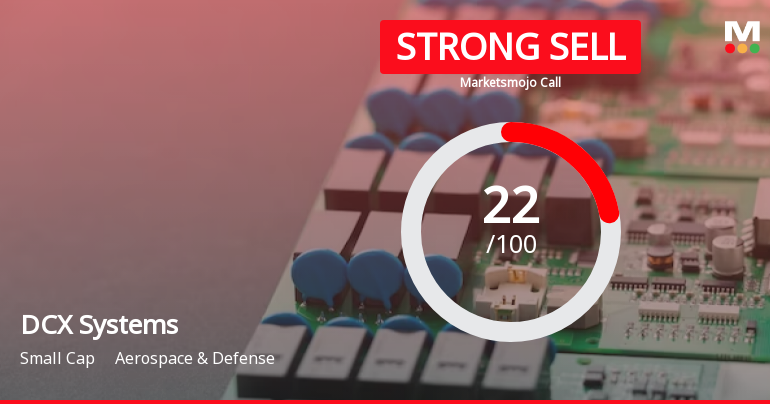
DCX Systems Ltd is Rated Strong Sell
DCX Systems Ltd is rated Strong Sell by MarketsMOJO, with this rating last updated on 03 June 2025. However, the analysis and financial metrics presented here reflect the stock’s current position as of 17 July 2026, providing investors with an up-to-date view of the company’s fundamentals, returns, and market standing.
Read full news article Announcements
General Update
17-Jul-2026 | Source : BSEIntimation of revision in official Website and Investor Relations webpage
Announcement under Regulation 30 (LODR)-Acquisition
15-Jul-2026 | Source : BSEIntimation of investment in ELTX Systems Pvt Ltd. an Associate and Joint Venture (Joint Venture with ELTA Systems Limited Israel) of the Company through a right issue.
Compliances-Certificate under Reg. 74 (5) of SEBI (DP) Regulations 2018
09-Jul-2026 | Source : BSECompliance Certificate under Reg. 74 (5) of SEBI (DP) Regulations.
Corporate Actions

No Upcoming Board Meetings

No Dividend history available

No Splits history available

No Bonus history available

No Rights history available
Quality key factors
Valuation key factors
Technicals key factors
 Technical Indicator Scale: Bearish, Mildly Bearish, Sideways, Mildly Bullish, Bullish Turned
 Shareholding Snapshot : Jun 2026
Shareholding Compare (%holding)
Promoters
None
Held by 3 Schemes (2.57%)
Held by 28 FIIs (1.72%)
Raneal Technologies Private Limited (28.63%)
Hdfc Large And Mid Cap Fund (2.55%)
36.83%
Quarterly Results Snapshot (Consolidated) - Mar'26 - QoQ

QoQ Growth in quarter ended Mar 2026 is 71.21% vs -37.23% in Dec 2025
QoQ Growth in quarter ended Mar 2026 is 87.65% vs 73.12% in Dec 2025
Half Yearly Results Snapshot (Consolidated) - Sep'25
Growth in half year ended Sep 2025 is 24.37% vs -30.37% in Sep 2024

Growth in half year ended Sep 2025 is -161.03% vs -72.28% in Sep 2024
Nine Monthly Results Snapshot (Consolidated) - Dec'25
YoY Growth in nine months ended Dec 2025 is 0.44% vs -21.21% in Dec 2024
YoY Growth in nine months ended Dec 2025 is -140.78% vs -57.57% in Dec 2024
Annual Results Snapshot (Consolidated) - Mar'26
YoY Growth in year ended Mar 2026 is -31.41% vs -23.88% in Mar 2025
YoY Growth in year ended Mar 2026 is -119.83% vs -48.69% in Mar 2025
About DCX Systems Ltd

Company Coordinates


