
Compare Deccan Healthcar with Similar Stocks
Stock DNA
Healthcare Services
INR 32 Cr (Micro Cap)
12.00
33
0.00%
0.02
2.25%
0.28
Total Returns (Price + Dividend) 
Deccan Healthcar for the last several years.
Risk Adjusted Returns v/s
Returns Beta

News
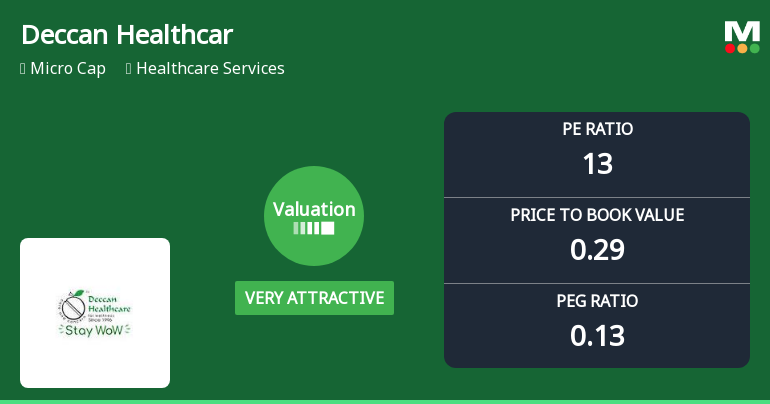
Deccan Health Care Ltd Valuation Shifts to Very Attractive Amidst Challenging Returns
Deccan Health Care Ltd has witnessed a significant shift in its valuation parameters, moving from an attractive to a very attractive price range, driven by a marked decline in its price-to-earnings and price-to-book value ratios. This repositioning comes amid a challenging market backdrop and a micro-cap status that continues to weigh on investor sentiment despite recent positive price movements.
Read full news articleAre Deccan Health Care Ltd latest results good or bad?
Deccan Health Care Ltd's latest financial results for Q4 FY26 reveal a complex operational landscape characterized by notable revenue growth juxtaposed against significant profitability challenges. The company reported a net sales figure of ₹20.98 crores, reflecting a quarter-on-quarter growth of 20.64%, which is a positive development compared to the previous quarter's decline. However, this revenue increase did not translate into improved profitability, as net profit fell sharply by 67.00% to ₹0.33 crores from ₹1.00 crore in Q3 FY26. The operating margin also contracted considerably, dropping from 9.95% in Q3 to 4.24% in Q4, indicating operational difficulties that may stem from either cost pressures or aggressive pricing strategies aimed at driving sales volume. Similarly, the PAT margin experienced a decline from 5.75% to 1.57%, further underscoring the strain on profitability despite the uptick in rev...
Read full news article
Deccan Health Care Q4 FY26: Profitability Plunges Despite Revenue Growth
Deccan Health Care Limited, a micro-cap healthcare products company specialising in nutraceutical, cosmeceutical and ayurveda products, reported a challenging Q4 FY26 with net profit declining 67.00% quarter-on-quarter to ₹0.33 crores despite revenue growing 20.64% to ₹20.98 crores. The ₹32.00 crore market capitalisation company saw its stock trade at ₹12.80, down 43.36% over the past year and significantly underperforming both the Sensex and its healthcare services sector peers.
Read full news article Announcements
Announcement under Regulation 30 (LODR)-Newspaper Publication
01-Jun-2026 | Source : BSEIntimation of Newspaper Publication of Financial Results for the quarter and year ended March 31 2026.
Audited Standalone And Consolidated Results For FY 2025-26
30-May-2026 | Source : BSEAudited Standalone and Consolidated Financial results for the FY 2025-26.
Announcement under Regulation 30 (LODR)-Press Release / Media Release
30-May-2026 | Source : BSEAnnual Results for the FY 2025-26 and Corporate Update
Corporate Actions

No Upcoming Board Meetings

No Dividend history available

No Splits history available

No Bonus history available

No Rights history available
Quality key factors
Valuation key factors
Technicals key factors
 Technical Indicator Scale: Bearish, Mildly Bearish, Sideways, Mildly Bullish, Bullish Turned
 Shareholding Snapshot : Mar 2026
Shareholding Compare (%holding)
Non Institution
None
Held by 0 Schemes
Held by 0 FIIs
Minto Purshotam Gupta (14.46%)
Focal Ventures Private Limited (9.69%)
53.97%
Quarterly Results Snapshot (Consolidated) - Mar'26 - QoQ

QoQ Growth in quarter ended Mar 2026 is 20.64% vs -18.74% in Dec 2025

QoQ Growth in quarter ended Mar 2026 is -67.00% vs 9.89% in Dec 2025
Half Yearly Results Snapshot (Consolidated) - Sep'25
Growth in half year ended Sep 2025 is 28.51% vs 19.21% in Sep 2024
Growth in half year ended Sep 2025 is 29.21% vs 5.95% in Sep 2024
Nine Monthly Results Snapshot (Consolidated) - Dec'25
YoY Growth in nine months ended Dec 2025 is 12.19% vs 24.11% in Dec 2024
YoY Growth in nine months ended Dec 2025 is 108.74% vs -24.82% in Dec 2024
Annual Results Snapshot (Consolidated) - Mar'26
YoY Growth in year ended Mar 2026 is 9.11% vs 25.67% in Mar 2025
YoY Growth in year ended Mar 2026 is 114.66% vs -22.15% in Mar 2025
About Deccan Health Care Ltd

Company Coordinates


