
 Price Point
Compare Dec.Gold Mines with Similar Stocks
ScoreDashboard
With a Operating Losses, the company has a Weak Long Term Fundamental Strength
- Low ability to service debt as the company has a high Debt to EBITDA ratio of -1.14 times
Risky - Negative EBITDA
Mojo ParametersStock DNA

Non - Ferrous Metals

INR 4,238 Cr (Small Cap)

NA (Loss Making)
10

0.00%

0.08

-10.61%

8.59
Total ReturnsTotal Returns (Price + Dividend) 
Dec.Gold Mines for the last several years.
Risk Adjusted Returns v/s
Returns Beta
 News & Corporate Actions
News
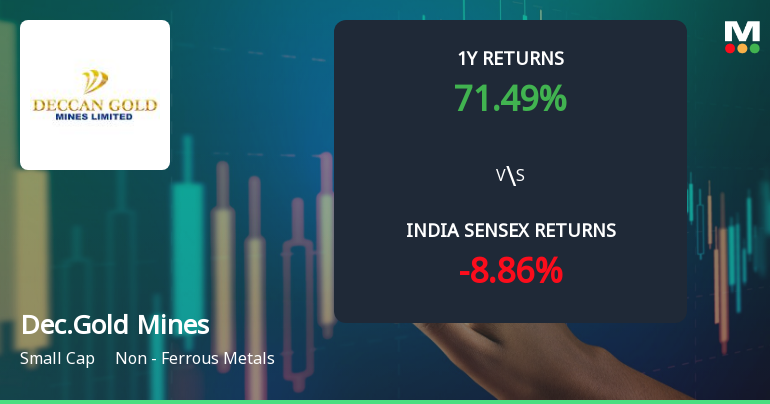
Deccan Gold Mines Ltd Technical Momentum Shifts Amid Mixed Indicator Signals
Deccan Gold Mines Ltd, a small-cap player in the Non - Ferrous Metals sector, has experienced a nuanced shift in its technical momentum, moving from a bullish to a mildly bullish stance. Despite a day-on-day price decline of 1.27%, the stock’s year-to-date return of 143.99% significantly outpaces the Sensex’s negative 12.19%, signalling strong underlying investor interest amid mixed technical signals.
Read full news article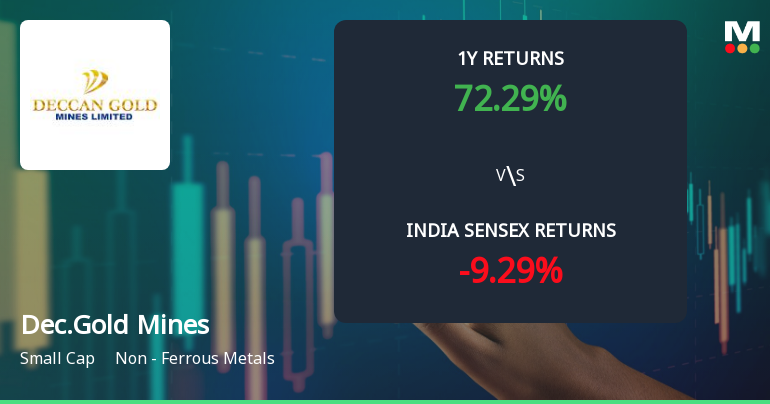
Deccan Gold Mines Ltd Shows Bullish Momentum Amid Technical Parameter Shift
Deccan Gold Mines Ltd, a small-cap player in the Non-Ferrous Metals sector, has demonstrated a notable shift in price momentum and technical indicators, signalling a transition from a mildly bullish to a more confident bullish trend. The stock’s recent 3.75% day gain to ₹225.25, coupled with improved technical readings, suggests renewed investor interest despite a Mojo Grade that remains cautious at Sell.
Read full news article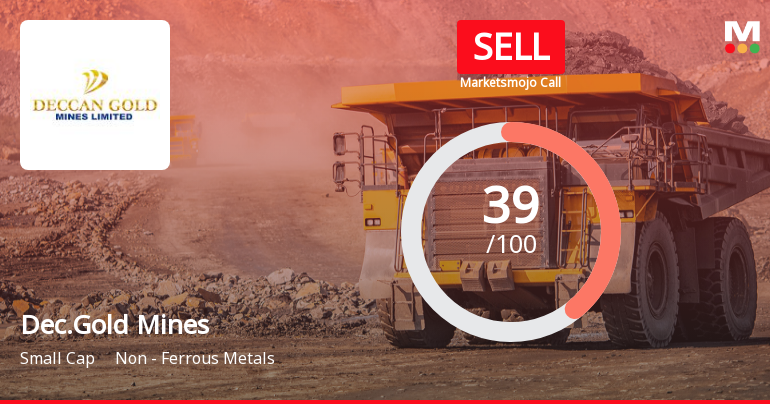
Deccan Gold Mines Ltd is Rated Sell
Deccan Gold Mines Ltd is rated 'Sell' by MarketsMOJO, with this rating last updated on 19 May 2026. However, the analysis and financial metrics discussed here reflect the stock's current position as of 19 September 2026, providing investors with an up-to-date view of the company’s fundamentals, valuation, financial trends, and technical outlook.
Read full news article Announcements
Corporate Actions

No Upcoming Board Meetings

No Dividend history available

No Splits history available

No Bonus history available

Deccan Gold Mines Ltd has announced 150:601 rights issue, ex-date: 09 Dec 25
Key FactorsQuality key factors
Valuation key factors
Technicals key factors
 Technical Indicator Scale: Bearish, Mildly Bearish, Sideways, Mildly Bullish, Bullish Turned Shareholding
Shareholding Snapshot : Jun 2026
Shareholding Compare (%holding)
Non Institution
None
Held by 0 Schemes
Held by 7 FIIs (2.13%)
Rama Mines Mauritius Limited (12.44%)
Hira Infra Tek Limited (7.99%)
52.66%
FinancialQuarterly Results Snapshot (Consolidated) - Jun'26 - YoY
 Compare with Peers
YoY Growth in quarter ended Jun 2026 is 57.89% vs -87.66% in Jun 2025
YoY Growth in quarter ended Jun 2026 is 73.23% vs -164.70% in Jun 2025

Half Yearly Results Snapshot (Consolidated) - Sep'25

Growth in half year ended Sep 2025 is -48.81% vs 8,300.00% in Sep 2024
Growth in half year ended Sep 2025 is -57.57% vs -399.24% in Sep 2024
Nine Monthly Results Snapshot (Consolidated) - Dec'25
YoY Growth in nine months ended Dec 2025 is -37.74% vs 1,897.44% in Dec 2024
YoY Growth in nine months ended Dec 2025 is -27.45% vs -221.21% in Dec 2024
Annual Results Snapshot (Consolidated) - Mar'26
YoY Growth in year ended Mar 2026 is 174.13% vs 40.00% in Mar 2025
YoY Growth in year ended Mar 2026 is -60.37% vs 48.50% in Mar 2025
 Company CV
About Deccan Gold Mines Ltd










