
Compare DEE Development with Similar Stocks
Dashboard
Poor Management Efficiency with a low ROCE of 7.70%
- The company has been able to generate a Return on Capital Employed (avg) of 7.70% signifying low profitability per unit of total capital (equity and debt)
Low ability to service debt as the company has a high Debt to EBITDA ratio of 3.69 times
Healthy long term growth as Operating profit has grown by an annual rate 54.83%
The company has declared Positive results for the last 5 consecutive quarters
With ROCE of 9.1, it has a Very Expensive valuation with a 3.4 Enterprise value to Capital Employed
Stock DNA
Industrial Manufacturing
INR 4,441 Cr (Small Cap)
58.00
36
0.00%
0.70
8.94%
4.96
Total Returns (Price + Dividend) 
DEE Development for the last several years.
Risk Adjusted Returns v/s
Returns Beta

News

DEE Development Engineers Ltd Locks at Upper Circuit With 5% Gain — Buyers Queue, Sellers Absent
At Rs 656.7, the buying was done — not because demand dried up, but because the exchange wouldn't let the stock go any higher. DEE Development Engineers Ltd locked at its upper circuit of 5% on 12 Jun 2026, with buyers queuing and no sellers willing to part with shares.
Read full news article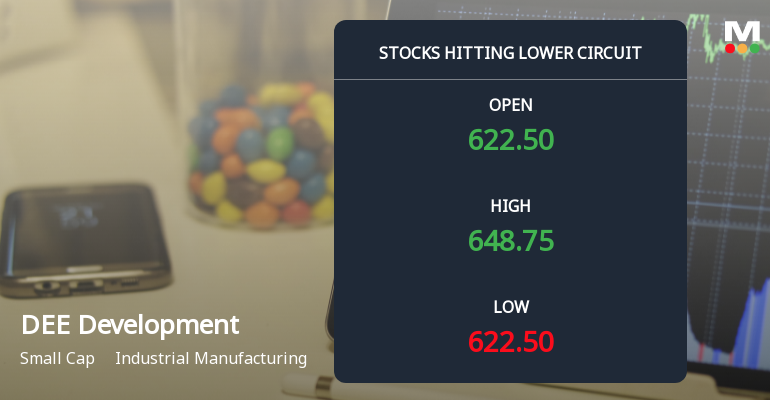
DEE Development Engineers Ltd Locks at Lower Circuit With 4.78% Loss — Sellers Queue, No Buyers in Sight
At Rs 623.0, sellers were still queuing — but there were no buyers willing to take the other side. DEE Development Engineers Ltd locked at its lower circuit of 5% on 11 Jun 2026, with unfilled sell orders and a frozen price.
Read full news article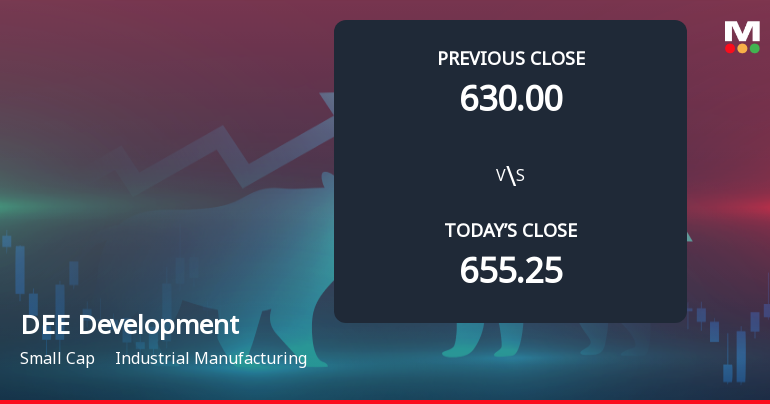
Announcements
Updates On The Monthly Execution And Order Position Of The Company
08-Jun-2026 | Source : BSEUpdates on the monthly execution and Order position of the Company
Announcement under Regulation 30 (LODR)-Analyst / Investor Meet - Intimation
08-Jun-2026 | Source : BSEIntimation of Schedule of Investors/Analyst Plant visit
Announcement under Regulation 30 (LODR)-Newspaper Publication
06-Jun-2026 | Source : BSENewspaper Publication of Notice of 1st EGM of FY 2026-27
Corporate Actions

No Upcoming Board Meetings

No Dividend history available

No Splits history available

No Bonus history available

No Rights history available
Quality key factors
Valuation key factors
Technicals key factors
 Technical Indicator Scale: Bearish, Mildly Bearish, Sideways, Mildly Bullish, Bullish Turned
 Shareholding Snapshot : Mar 2026
Shareholding Compare (%holding)
Promoters
None
Held by 4 Schemes (12.95%)
Held by 10 FIIs (0.98%)
Krishan Lalit Bansal (50.82%)
Kotak Elss Tax Saver Fund (6.51%)
13.68%
Quarterly Results Snapshot (Consolidated) - Mar'26 - QoQ

QoQ Growth in quarter ended Mar 2026 is 26.13% vs 6.17% in Dec 2025
QoQ Growth in quarter ended Mar 2026 is 53.23% vs 2.35% in Dec 2025
Half Yearly Results Snapshot (Consolidated) - Sep'25
Growth in half year ended Sep 2025 is 30.28% vs 12.81% in Sep 2024

Growth in half year ended Sep 2025 is 22.04% vs 379.28% in Sep 2024
Nine Monthly Results Snapshot (Consolidated) - Dec'25
YoY Growth in nine months ended Dec 2025 is 44.26% vs -0.84% in Dec 2024
YoY Growth in nine months ended Dec 2025 is 307.10% vs -15.48% in Dec 2024
Annual Results Snapshot (Consolidated) - Mar'26
YoY Growth in year ended Mar 2026 is 38.03% vs 4.89% in Mar 2025
YoY Growth in year ended Mar 2026 is 77.31% vs 66.46% in Mar 2025
About DEE Development Engineers Ltd

Company Coordinates


