Deep Health AI

  • Market Cap: Micro Cap
  • Industry: Gems, Jewellery And Watches
  • ISIN: INE005G01026
  • NSEID:
  • BSEID: 539559
INR
1.71
-0.02 (-1.16%)
BSENSE

Sep 25, 03:30 PM

BSE+NSE Vol: 4.29 lacs

  • Price Points
  • Score
  • Mojo Parameters
  • Total Return
  • News and Corporate Actions
  • Key factors
  • Shareholding
  • Financials
  • CompanyCV
stock-summaryPrice Point
High/Low

1Day

52 Week

Valuation
Technical
Day's Volume

CASH

4.29 lacs (48.62%) Volume

Shareholding (Jun 2026)

FII

0.35%

Held by 1 FIIs

DII

0.00%

Held by 0 DIIs

Promoter

0.03%

Why is Deep Health AI India Ltd falling/rising?

06-Sep-2026

As of 05-Sep, the stock price of Deep Health AI India Ltd is currently at 1.84, reflecting a short-term increase of 1.66%. However, the stock has seen significant long-term declines, with a year-to-date drop of 68.71%, and overall investor sentiment remains cautious despite a high dividend yield of 5.52%.

As of 05-Sep, the stock price of Deep Health AI India Ltd is rising, currently at 1.84, which reflects a change of 0.03 or an increase of 1.66%. This rise is notable as it outperformed its sector by 0.65% today. However, despite this short-term gain, the stock has been experiencing significant declines over longer periods, with a year-to-date drop of 68.71% and a one-year decline of 56.91%. <BR><BR>The stock is trading below its moving averages across various time frames, indicating a general downward trend. Additionally, there has been a notable decrease in investor participation, with delivery volume falling by 41.54% compared to the five-day average. This suggests that while there may be a slight uptick in price today, the overall sentiment remains cautious due to the stock's poor performance over the past months and years. <BR><BR>Furthermore, the stock does offer a high dividend yield of 5.52%, which may attract some investors looking for income, but the significant declines in stock price over time overshadow this positive aspect. Overall, while there is a minor rise in price today, the broader context indicates ongoing challenges for Deep Health AI India Ltd.

View full answer

Who are in the management team of Deep Health AI?

01-Sep-2026

The management team of Deep Health AI includes Ganpat Lal Nyati (Executive Director), Sonali Laddha (CEO), and several non-executive directors: Narendra Shrimali, Ashish Jain, and Vinod Mandowara, along with Prashant Tali (Company Secretary) and Kaushal Jain (Additional Director).

The management team of Deep Health AI includes the following individuals:<BR><BR>1. **Ganpat Lal Nyati** - Executive Director & Wholetime Director<BR>2. **Sonali Laddha** - Executive Director & CEO<BR>3. **Narendra Shrimali** - Non-Executive & Non-Independent Director<BR>4. **Ashish Jain** - Non-Executive & Non-Independent Director<BR>5. **Vinod Mandowara** - Non-Executive & Non-Independent Director<BR>6. **Prashant Tali** - Company Secretary & Compliance Officer<BR>7. **Kaushal Jain** - Additional Director<BR><BR>If you have any more questions about Deep Health AI or its operations, feel free to ask!

View full answer

What does Deep Health AI do?

01-Sep-2026

Deep Health AI India Ltd manufactures and wholesales gold set jewellery with diamonds and provides consultancy services to the Pharmaceutical Industry. As of June 2026, it reported net sales of 0 Cr and a net profit of -2 Cr, with a market cap of INR 27 Cr.

Overview:<BR>Deep Health AI India Ltd operates in the Gems, Jewellery and Watches industry, focusing on the manufacture and wholesale of gold set jewellery with diamonds, as well as providing consultancy services to the Pharmaceutical Industry.<BR><BR>History:<BR>Deep Health AI India Ltd was established in 1994. The company has recently expanded its operations to include consultancy services for the Pharmaceutical Industry. The latest quarterly results reported are for June 2026.<BR><BR>Financial Snapshot:<BR>Most recent Net Sales: 0 Cr (Quarterly Results - Jun 2026) <BR>Most recent Net Profit: -2 Cr (Quarterly Results - Jun 2026) <BR>Market-cap value: INR 27 Cr (Micro Cap)<BR><BR>Key Metrics:<BR>P/E: 6.00 <BR>Industry P/E: 49 <BR>Dividend Yield: 5.38% <BR>Debt-Equity: -0.17 <BR>Return on Equity: 13.41% <BR>Price-to-Book: 0.52 <BR><BR>Contact Details:<BR>Address: 101 1st Floor Hemu Plaza, D J Road Vile Parle (W) Mumbai Maharashtra : 400056 <BR>Tel: 91-22-26174321/65043314 <BR>Website: http://www.deepdiamondindialimited.com

View full answer

Who are the peers of the Deep Health AI?

01-Sep-2026

Deep Health AI's peers include Rajnish Retail, Shoora Designs, Koura Fine Diamo, and others, with varying management risks and growth ratings. Deep Health AI has a 1-year return of -57.96%, better than Rajnish Retail's -67.47% but worse than Koura Fine Diamo's 35.61%.

Peers: The peers of Deep Health AI are Rajnish Retail, Shoora Designs, Koura Fine Diamo, Kanani Industrie, U. H. Zaveri, Orosil Smiths, Goenka Diamond, Kenvi Jewels, Darshan Orna.<BR><BR>Quality Snapshot: Excellent management risk is observed at Rajnish Retail and Orosil Smiths, while Average management risk is found at Deep Health AI. Below Average management risk is noted at Shoora Designs, Koura Fine Diamo, Kanani Industrie, U. H. Zaveri, Goenka Diamond, Kenvi Jewels, Darshan Orna, and the rest. Growth is rated as Good for Koura Fine Diamo and Deep Health AI, while Below Average growth is seen at Rajnish Retail, Shoora Designs, Kanani Industrie, U. H. Zaveri, Goenka Diamond, and the rest. Average growth is noted at Kenvi Jewels and Darshan Orna. Capital Structure is rated as Good for Rajnish Retail, Koura Fine Diamo, and Deep Health AI, while Below Average capital structure is found at Kanani Industrie, U. H. Zaveri, Orosil Smiths, Goenka Diamond, Kenvi Jewels, and the rest.<BR><BR>Return Snapshot: Koura Fine Diamo has the highest 1-year return at 35.61%, while Rajnish Retail has the lowest at -67.47%. Deep Health AI's 1-year return of -57.96% is better than Rajnish Retail's but worse than Koura Fine Diamo's. Additionally, the six-month returns are negative for Rajnish Retail, Kanani Industrie, U. H. Zaveri, Goenka Diamond, Kenvi Jewels, Darshan Orna, and Shubhlaxmi Jewel.

View full answer

How big is Deep Health AI?

01-Sep-2026

As of 31st August, Deep Health AI India Ltd has a market capitalization of 27.00 Cr, with Net Sales of 4.55 Cr and a Net Profit loss of 1.09 Cr over the latest four quarters. Shareholder's Funds are 22.36 Cr, and Total Assets are 23.96 Cr as of March 2025.

As of 31st August, Deep Health AI India Ltd has a market capitalization of 27.00 Cr, categorizing it as a Micro Cap company.<BR><BR>In the latest four quarters, the company reported Net Sales of 4.55 Cr. However, it experienced a loss of 1.09 Cr in Net Profit during the same period.<BR><BR>The latest annual reporting period for the balance sheet is March 2025. Shareholder's Funds stood at 22.36 Cr, while Total Assets were valued at 23.96 Cr.

View full answer

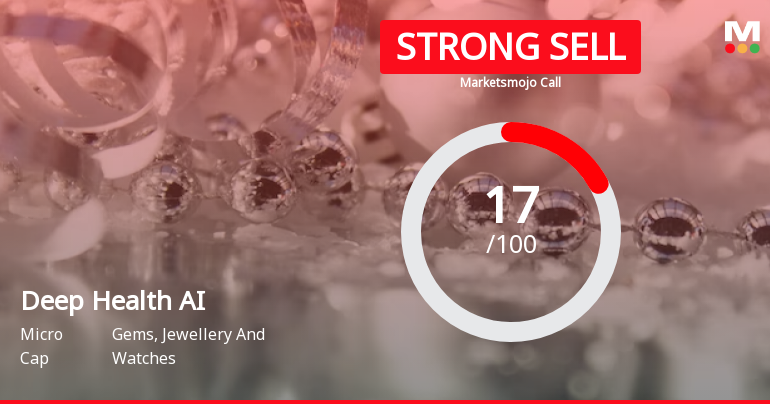
Should I buy, sell or hold Deep Health AI India Ltd?

15-Aug-2026

Are Deep Health AI India Ltd latest results good or bad?

13-Aug-2026

Deep Health AI India Ltd's latest results are concerning, showing a net loss of ₹4.51 crores in Q4 FY26, a 1,388.57% decline year-on-year, and a revenue drop of 44.44%. The company faces significant operational and financial challenges, reflected in a 50.80% decline in stock value over the past year.

The latest results for Deep Health AI India Ltd are concerning and indicate a significant decline in performance. In the fourth quarter of FY26, the company reported a net loss of ₹4.51 crores, which is a staggering 1,388.57% decrease compared to the same quarter last year. This marks a drastic shift from profitability to substantial losses, highlighting severe operational challenges.<BR><BR>Revenue for the same quarter was only ₹0.25 crores, reflecting a 44.44% decline year-on-year and a 50% drop from the previous quarter. This revenue collapse suggests that the company is struggling to establish a sustainable business model, especially as it attempts to diversify into pharmaceutical consultancy services.<BR><BR>Additionally, the company's profit before tax was negative ₹5.54 crores, indicating significant one-off charges or exceptional items that have not been detailed. The operational metrics reveal a company in distress, with an operating margin of just 20% on minimal revenue, and a PAT margin of -1,804%.<BR><BR>The stock has also suffered severely, declining 50.80% over the past year, underperforming significantly compared to broader market indices. Given these factors, the overall assessment of Deep Health AI India Ltd's latest results is decidedly negative, suggesting that the company is facing critical operational and financial challenges.

View full answer

When is the next results date for Deep Health AI India Ltd?

11-Aug-2026

The next results date for Deep Health AI India Ltd is 13 August 2026.

The next results date for Deep Health AI India Ltd is scheduled for 13 August 2026.

View full answer

How has been the historical performance of Deep Diamond?

02-Dec-2025

Deep Diamond has experienced a significant decline in net sales over three years, dropping from 7.67 Cr in Mar'23 to 1.26 Cr in Mar'25, while improving profitability metrics such as operating profit and profit before tax in the latest year. Total liabilities and assets increased slightly, and shareholder's funds strengthened, indicating a challenging environment with some recovery in profitability.

Answer:<BR>The historical performance of Deep Diamond shows a significant decline in net sales over the past three years, dropping from 7.67 Cr in Mar'23 to 2.56 Cr in Mar'24, and further down to 1.26 Cr in Mar'25. Total operating income followed a similar trend, decreasing from 7.67 Cr in Mar'23 to 2.56 Cr in Mar'24, and then to 1.26 Cr in Mar'25. Despite the decline in sales, the company managed to improve its operating profit (PBDIT) from 1.85 Cr in Mar'23 to 0.84 Cr in Mar'24, and further to 1.20 Cr in Mar'25. Profit before tax also increased from 1.73 Cr in Mar'23 to 0.57 Cr in Mar'24, reaching 1.09 Cr in Mar'25. The profit after tax showed a similar pattern, with values of 1.26 Cr, 0.42 Cr, and 0.86 Cr for the respective years. The earnings per share (EPS) decreased from 0.26 in Mar'23 to 0.08 in Mar'24, but increased to 0.17 in Mar'25. <BR><BR>In terms of balance sheet results, total liabilities rose slightly from 23.06 Cr in Mar'24 to 23.96 Cr in Mar'25, while total assets also increased from 23.06 Cr to 23.96 Cr in the same period. Shareholder's funds improved from 20.42 Cr in Mar'24 to 22.36 Cr in Mar'25, indicating a strengthening equity position. The cash flow from operating activities remained stagnant at 0.00 Cr in Mar'25, while it was negative at -5.00 Cr in Mar'24. The closing cash and cash equivalents remained unchanged at 3.00 Cr for both years. Overall, Deep Diamond's financial performance reflects a challenging environment with declining sales but some recovery in profitability metrics in the latest year.

View full answer

Is Deep Diamond overvalued or undervalued?

09-Jun-2025

As of May 30, 2025, Deep Diamond is considered very expensive and overvalued, with a PE ratio of 15.01, an EV to EBIT of 12.30, and a disappointing year-to-date return of -30.99%, especially compared to its peers and the Sensex's positive return of 5.61%.

As of 30 May 2025, the valuation grade for Deep Diamond has moved from risky to very expensive. This indicates a significant shift in the perception of the company's value, suggesting that it is currently overvalued. The key ratios reflect this sentiment, with a PE ratio of 15.01, an EV to EBIT of 12.30, and a ROE of 3.94%. <BR><BR>In comparison to its peers, Deep Diamond's valuation stands out unfavorably; for instance, Titan Company has a PE ratio of 94.61 and Kalyan Jewellers at 81.3, both indicating a more robust market position despite their higher valuations. The company's recent stock performance has also been underwhelming, with a year-to-date return of -30.99%, contrasting sharply with the Sensex's positive return of 5.61% over the same period. Overall, Deep Diamond appears to be overvalued in the current market context.

View full answer

What is the technical trend for Deep Diamond?

09-Jun-2025

As of June 5, 2025, Deep Diamond's trend is mildly bearish, with daily moving averages indicating a bearish outlook, while weekly indicators show mixed signals, leading to an overall weak trend.

As of 5 June 2025, the technical trend for Deep Diamond has changed from bearish to mildly bearish. The current stance is mildly bearish, driven by the daily moving averages indicating a mildly bearish outlook, while the weekly MACD shows a mildly bullish signal, contrasting with the monthly MACD which remains bearish. The Bollinger Bands are bearish on both weekly and monthly time frames, and the KST indicates a mildly bullish trend weekly but mildly bearish monthly. Overall, the lack of strong signals from the RSI and Dow Theory suggests a weak trend in both weekly and monthly perspectives.

View full answer

Who are the top shareholders of the Deep Diamond?

06-Jun-2025

The top shareholders of Deep Diamond are primarily individual investors, holding 89.27% of shares. Notable shareholders include Bhavishya Ecommerce Private Limited at 3.55%, and Prakash Rikhabchand Solanki, the main promoter, with 0.02%.

The top shareholders of Deep Diamond include individual investors, who hold a significant 89.27% of the shares. Among the notable public shareholders, Bhavishya Ecommerce Private Limited holds 3.55%. The promoter with the highest holding is Prakash Rikhabchand Solanki, with a stake of 0.02%. Additionally, there is one Foreign Institutional Investor (FII) that holds 1.04% of the shares. There are no pledged promoter holdings or mutual fund schemes involved in the shareholding structure.

View full answer

Has Deep Diamond declared dividend?

06-Jun-2025

No Dividend History Available

iScoreScore

Dashboard

1

With a Operating Losses, the company has a Weak Long Term Fundamental Strength

  • Poor long term growth as Net Sales has grown by an annual rate of 7.19% over the last 5 years
  • Company's ability to service its debt is weak with a poor EBIT to Interest (avg) ratio of 0.29
2

Flat results in Jun 26

3

Below par performance in long term as well as near term

stock-summaryMojo Parameters

Mojo Parameters

Loading Valuation Snapshot...

Stock DNA

stock-summary
Industry

Gems, Jewellery And Watches

stock-summary
Market cap

INR 25 Cr (Micro Cap)

stock-summary
P/E

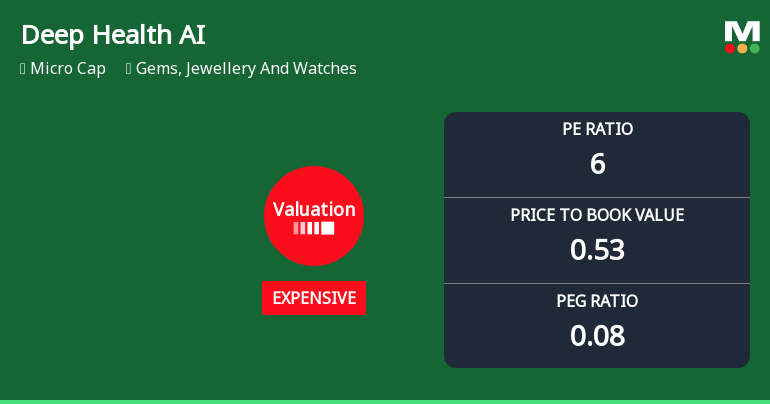
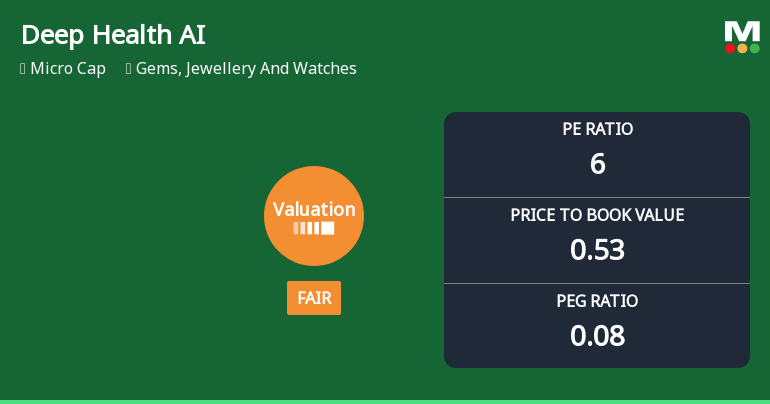
5.00

stock-summary
Industry P/E

47

stock-summary
Dividend Yield

5.78%

stock-summary
Debt Equity

-0.17

stock-summary
Return on Equity

13.41%

stock-summary
Price to Book

0.49

Revenue and Profits:
Net Sales:
0 Cr
(Quarterly Results - Jun 2026)
Net Profit:
-2 Cr
stock-summaryTotal Returns
Total Returns (Price + Dividend) stock-summary
Dividend Yield (5.78%)
TimePeriod
Price Return
Dividend Return
Total Return
3 Months
-20.47%
0%
-20.47%
6 Months
-18.18%
0%
-18.18%
1 Year
-58.99%
2.20%
-56.79%
2 Years
-81.77%
1.20%
-80.57%
3 Years
-68.33%
1.87%
-66.46%
4 Years
-86.39%
0.66%
-85.73%
5 Years
0%
8.47%
8.47%

Latest dividend: 0.1 per share ex-dividend date: Nov-07-2025

Risk Adjusted Returns v/s stock-summary
Returns Beta
Icon
Beta has not been calculated since enough price history is not available
stock-summaryNews & Corporate Actions

Announcements stock-summary

Announcement under Regulation 30 (LODR)-Resignation of Director

11-Sep-2026 | Source : BSE

Pursuant to Regulation 30 of SEBI (Listing Obligations and Disclosure Requirements) Regulations 2015 (Listing Regulations) we wish to inform you that Mr. Rajesh Nandkishore Pherwani (DIN: 07576485) has tendered his resignation on September 11 2026 as the Non-Executive Independent Director of the Company with effect from close of business hours on September 11 2026. The details required in terms of Regulation 30 read with Schedule III - Para A of Part A of the Listing Regulations and SEBI Circular SEBI Circular No. SEBI/HO/CFD/PoD2/CIR/P/0155 dated January 30 2026 are given in Annexure - I . The letter of resignation received from Mr. Rajesh Nandkishore Pherwani is enclosed herewith as Annexure - II.

Announcement under Regulation 30 (LODR)-Change in Management

11-Sep-2026 | Source : BSE

Pursuant to Regulation 30 of SEBI (Listing Obligations and Disclosure Requirements) Regulations 2015 (Listing Regulations) we wish to inform you that Mr. Rajesh Nandkishore Pherwani (DIN: 07576485) has tendered his resignation on September 11 2026 as the Non-Executive Independent Director of the Company with effect from close of business hours on September 11 2026. The details required in terms of Regulation 30 read with Schedule III - Para A of Part A of the Listing Regulations and SEBI Circular SEBI Circular No. SEBI/HO/CFD/PoD2/CIR/P/0155 dated January 30 2026 are given in Annexure - I . The letter of resignation received from Mr. Rajesh Nandkishore Pherwani is enclosed herewith as Annexure - II.

Disclosure Under Regulation 30 Of The SEBI (Listing Obligations And Disclosure Requirements) Regulations 2015

08-Sep-2026 | Source : BSE

Pursuant to Regulation 36(1)(b) of the SEBI (Listing Obligations & Disclosure Requirements) Regulations 2015 the Company has sent a letter to those Members whose email addresses are not registered with Company/ MUFG Intime India Private Limited - Registrar and Transfer Agent / National Securities Depository Limited and/or Central Depository Services (India) Limited stating the weblink where the Annual Report is uploaded on website. The above information is being made available on the website of the Company: https://deephealthaiindia.com/wp-content/uploads/2026/09/Annual-Report-FY-2025-26 Final.pdf Kindly take the same on your records. Thanking you Yours faithfully

Corporate Actions stock-summary

stock-summary
BOARD MEETING

No Upcoming Board Meetings

stock-summary
DIVIDEND

Deep Health AI India Ltd has declared 10% dividend, ex-date: 07 Nov 25

stock-summary
SPLITS

Deep Health AI India Ltd has announced 1:10 stock split, ex-date: 20 Jan 23

stock-summary
BONUS

No Bonus history available

stock-summary
RIGHTS

Deep Health AI India Ltd has announced 2:1 rights issue, ex-date: 29 Aug 25

stock-summaryKey Factors

Quality key factors stock-summary

Factor
Value
Sales Growth (5y)
7.19%
EBIT Growth (5y)
71.17%
EBIT to Interest (avg)
0.29
Debt to EBITDA (avg)
Negative Net Debt
Net Debt to Equity (avg)
-0.17
Sales to Capital Employed (avg)
0.12
Tax Ratio
66.15%
Dividend Payout Ratio
0
Pledged Shares
0
Institutional Holding
0.35%
ROCE (avg)
2.89%
ROE (avg)
6.14%

Valuation key factors

Factor
Value
P/E Ratio
5
Industry P/E
47
Price to Book Value
0.49
EV to EBIT
12.20
EV to EBITDA
12.20
EV to Capital Employed
0.38
EV to Sales
3.54
PEG Ratio
0.07
Dividend Yield
5.78%
ROCE (Latest)
7.83%
ROE (Latest)
13.41%

Technicals key factors

Indicator
Weekly
Monthly
MACD
Mildly Bullish
Bearish
RSI
Bullish
No Signal
Bollinger Bands
Bearish
Bearish
Moving Averages
Bearish (Daily)
KST
Mildly Bullish
Bearish
Dow Theory
Mildly Bearish
Mildly Bearish
stock-summary Technical Indicator Scale: Bearish, Mildly Bearish, Sideways, Mildly Bullish, Bullish  Turned 
stock-summaryShareholding
Shareholding Snapshot : Jun 2026stock-summary
Shareholding Compare (%holding) stock-summary
Majority shareholders

Non Institution

Pledged Promoter Holdings

None

Mutual Funds

Held by 0 Schemes

FIIs

Held by 1 FIIs (0.35%)

Promoter with highest holding

Prakash Rikhabchand Solanki (0.01%)

Highest Public shareholder

None

Individual Investors Holdings

97.64%

stock-summaryFinancial
[
  {
    "link": "quarterly",
    "btn_text": "All Quarterly Results",
    "header": "Quarterly Results Snapshot (Consolidated) - Jun'26 - YoY",
    "rhs": [
      {
        "prefix": "Net Sales ",
        "suffix": "YoY Growth in quarter ended Jun 2026 is 200.00% vs -70.59% in Jun 2025",
        "dir": 1
      },
      {
        "prefix": "Consolidated Net Profit ",
        "suffix": "YoY Growth in quarter ended Jun 2026 is -3,683.33% vs -79.31% in Jun 2025",
        "dir": -1
      }
    ],
    "table": {
      "header": [
        "Jun'26",
        "Jun'25",
        "Change(%)"
      ],
      "body": [
        {
          "field": "Net Sales",
          "val1": "0.45",
          "val2": "0.15",
          "chgp": "200.00%",
          "chgp_class": "positive"
        },
        {
          "field": "Operating Profit (PBDIT) excl Other Income",
          "val1": "-2.06",
          "val2": "-0.05",
          "chgp": "-4,020.00%",
          "chgp_class": "negative"
        },
        {
          "field": "Interest",
          "val1": "0.01",
          "val2": "0.01",
          "chgp": "",
          "chgp_class": "neutral"
        },
        {
          "field": "Exceptional Items",
          "val1": "0.00",
          "val2": "0.00",
          "chgp": "",
          "chgp_class": "neutral"
        },
        {
          "field": "Consolidate Net Profit",
          "val1": "-2.15",
          "val2": "0.06",
          "chgp": "-3,683.33%",
          "chgp_class": "negative"
        },
        {
          "field": "Operating Profit Margin (Excl OI)",
          "val1": "-457.78%",
          "val2": "-33.33%",
          "chgp": "-424.45%",
          "chgp_class": "negative"
        }
      ]
    }
  },
  {
    "link": "half-yearly",
    "btn_text": "All Half Yearly Results",
    "header": "Half Yearly Results Snapshot (Consolidated) - Sep'25",
    "rhs": [
      {
        "prefix": "Net Sales ",
        "suffix": " Growth in half year ended Sep 2025 is 332.10% vs -31.93% in Sep 2024",
        "dir": 1
      },
      {
        "prefix": "Consolidated Net Profit ",
        "suffix": " Growth in half year ended Sep 2025 is 430.61% vs 372.22% in Sep 2024",
        "dir": 1
      }
    ],
    "table": {
      "header": [
        "Sep'25",
        "Sep'24",
        "Change(%)"
      ],
      "body": [
        {
          "field": "Net Sales",
          "val1": "3.50",
          "val2": "0.81",
          "chgp": "332.10%",
          "chgp_class": "positive"
        },
        {
          "field": "Operating Profit (PBDIT) excl Other Income",
          "val1": "3.18",
          "val2": "0.37",
          "chgp": "759.46%",
          "chgp_class": "positive"
        },
        {
          "field": "Interest",
          "val1": "0.01",
          "val2": "0.05",
          "chgp": "-80.00%",
          "chgp_class": "positive"
        },
        {
          "field": "Exceptional Items",
          "val1": "0.00",
          "val2": "0.00",
          "chgp": "",
          "chgp_class": "neutral"
        },
        {
          "field": "Consolidate Net Profit",
          "val1": "2.60",
          "val2": "0.49",
          "chgp": "430.61%",
          "chgp_class": "positive"
        },
        {
          "field": "Operating Profit Margin (Excl OI)",
          "val1": "90.86%",
          "val2": "45.68%",
          "chgp": "45.18%",
          "chgp_class": "positive"
        }
      ]
    }
  },
  {
    "link": "nine-monthly",
    "btn_text": "All Nine Monthly Results",
    "header": "Nine Monthly Results Snapshot (Consolidated) - Dec'25",
    "rhs": [
      {
        "prefix": "Net Sales ",
        "suffix": "YoY Growth in nine months ended Dec 2025 is 393.83% vs -60.49% in Dec 2024",
        "dir": 1
      },
      {
        "prefix": "Consolidated Net Profit ",
        "suffix": "YoY Growth in nine months ended Dec 2025 is 964.15% vs 51.43% in Dec 2024",
        "dir": 1
      }
    ],
    "table": {
      "header": [
        "Dec'25",
        "Dec'24",
        "Change(%)"
      ],
      "body": [
        {
          "field": "Net Sales",
          "val1": "4.00",
          "val2": "0.81",
          "chgp": "393.83%",
          "chgp_class": "positive"
        },
        {
          "field": "Operating Profit (PBDIT) excl Other Income",
          "val1": "3.28",
          "val2": "0.22",
          "chgp": "1,390.91%",
          "chgp_class": "positive"
        },
        {
          "field": "Interest",
          "val1": "0.02",
          "val2": "0.06",
          "chgp": "-66.67%",
          "chgp_class": "positive"
        },
        {
          "field": "Exceptional Items",
          "val1": "0.00",
          "val2": "0.00",
          "chgp": "",
          "chgp_class": "neutral"
        },
        {
          "field": "Consolidate Net Profit",
          "val1": "5.64",
          "val2": "0.53",
          "chgp": "964.15%",
          "chgp_class": "positive"
        },
        {
          "field": "Operating Profit Margin (Excl OI)",
          "val1": "82.00%",
          "val2": "27.16%",
          "chgp": "54.84%",
          "chgp_class": "positive"
        }
      ]
    }
  },
  {
    "link": "annual",
    "btn_text": "All Annual Results",
    "header": "Annual Results Snapshot (Consolidated) - Mar'26",
    "rhs": [
      {
        "prefix": "Net Sales ",
        "suffix": "YoY Growth in year ended Mar 2026 is 237.30% vs -50.78% in Mar 2025",
        "dir": 1
      },
      {
        "prefix": "Consolidated Net Profit ",
        "suffix": "YoY Growth in year ended Mar 2026 is 28.41% vs 120.00% in Mar 2025",
        "dir": -1
      }
    ],
    "table": {
      "header": [
        "Mar'26",
        "Mar'25",
        "Change(%)"
      ],
      "body": [
        {
          "field": "Net Sales",
          "val1": "4.25",
          "val2": "1.26",
          "chgp": "237.30%",
          "chgp_class": "positive"
        },
        {
          "field": "Operating Profit (PBDIT) excl Other Income",
          "val1": "3.34",
          "val2": "0.45",
          "chgp": "642.22%",
          "chgp_class": "positive"
        },
        {
          "field": "Interest",
          "val1": "0.03",
          "val2": "0.09",
          "chgp": "-66.67%",
          "chgp_class": "positive"
        },
        {
          "field": "Exceptional Items",
          "val1": "-5.77",
          "val2": "0.00",
          "chgp": "",
          "chgp_class": "neutral"
        },
        {
          "field": "Consolidate Net Profit",
          "val1": "1.13",
          "val2": "0.88",
          "chgp": "28.41%",
          "chgp_class": "positive"
        },
        {
          "field": "Operating Profit Margin (Excl OI)",
          "val1": "78.59%",
          "val2": "35.71%",
          "chgp": "42.88%",
          "chgp_class": "positive"
        }
      ]
    }
  }
]

Quarterly Results Snapshot (Consolidated) - Jun'26 - YoYstock-summary

Jun'26
Jun'25
Change(%)
Net Sales
0.45
0.15
200.00%
Operating Profit (PBDIT) excl Other Income
-2.06
-0.05
-4,020.00%
Interest
0.01
0.01
Exceptional Items
0.00
0.00
Consolidate Net Profit
-2.15
0.06
-3,683.33%
Operating Profit Margin (Excl OI)
-457.78%
-33.33%
-424.45%
Values in Rs Cr.
Direction Arrows
Net Sales

YoY Growth in quarter ended Jun 2026 is 200.00% vs -70.59% in Jun 2025

Direction Arrows
Consolidated Net Profit

YoY Growth in quarter ended Jun 2026 is -3,683.33% vs -79.31% in Jun 2025

Half Yearly Results Snapshot (Consolidated) - Sep'25stock-summary

Sep'25
Sep'24
Change(%)
Net Sales
3.50
0.81
332.10%
Operating Profit (PBDIT) excl Other Income
3.18
0.37
759.46%
Interest
0.01
0.05
-80.00%
Exceptional Items
0.00
0.00
Consolidate Net Profit
2.60
0.49
430.61%
Operating Profit Margin (Excl OI)
90.86%
45.68%
45.18%
Values in Rs Cr.
Direction Arrows
Net Sales

Growth in half year ended Sep 2025 is 332.10% vs -31.93% in Sep 2024

Direction Arrows
Consolidated Net Profit

Growth in half year ended Sep 2025 is 430.61% vs 372.22% in Sep 2024

Nine Monthly Results Snapshot (Consolidated) - Dec'25stock-summary

Dec'25
Dec'24
Change(%)
Net Sales
4.00
0.81
393.83%
Operating Profit (PBDIT) excl Other Income
3.28
0.22
1,390.91%
Interest
0.02
0.06
-66.67%
Exceptional Items
0.00
0.00
Consolidate Net Profit
5.64
0.53
964.15%
Operating Profit Margin (Excl OI)
82.00%
27.16%
54.84%
Values in Rs Cr.
Direction Arrows
Net Sales

YoY Growth in nine months ended Dec 2025 is 393.83% vs -60.49% in Dec 2024

Direction Arrows
Consolidated Net Profit

YoY Growth in nine months ended Dec 2025 is 964.15% vs 51.43% in Dec 2024

Annual Results Snapshot (Consolidated) - Mar'26stock-summary

Mar'26
Mar'25
Change(%)
Net Sales
4.25
1.26
237.30%
Operating Profit (PBDIT) excl Other Income
3.34
0.45
642.22%
Interest
0.03
0.09
-66.67%
Exceptional Items
-5.77
0.00
Consolidate Net Profit
1.13
0.88
28.41%
Operating Profit Margin (Excl OI)
78.59%
35.71%
42.88%
Values in Rs Cr.
Direction Arrows
Net Sales

YoY Growth in year ended Mar 2026 is 237.30% vs -50.78% in Mar 2025

Direction Arrows
Consolidated Net Profit

YoY Growth in year ended Mar 2026 is 28.41% vs 120.00% in Mar 2025

stock-summaryCompany CV
About Deep Health AI India Ltd stock-summary

stock-summary
Deep Health AI India Ltd
Micro Cap
Gems, Jewellery And Watches
Deep Diamond India Limited was established in 1994, with the object to engaged in the manufacture and wholesale of gold set jewellery with diamonds. The company also deals in loose diamonds, solitaires, and gold frames. It offers Pendants, Nose pins, Rings, Bangles, Earrings, Pendant sets, Necklace sets, Bracelets, and others. From financial year 2022-23, the Company has also started business of providing consultancy service to Pharmaceutical Industry.
Company Coordinates stock-summary
Company Details
101 1st Floor Hemu Plaza, D J Road Vile Parle (W) Mumbai Maharashtra : 400056
stock-summary
Tel: 91-22-26174321/65043314
stock-summary
Registrar Details
Mondkar Computers Pvt Ltd , 21 Shakil Niwas , Opp. Satya Saibaba Temple, Mahakali Caves Road, Andheri (E), Mumbai
Footer loading