
Compare Deep Health AI with Similar Stocks
Dashboard
Weak Long Term Fundamental Strength with an average Return on Equity (ROE) of 6.14%
- Company's ability to service its debt is weak with a poor EBIT to Interest (avg) ratio of 1.00
With ROE of 13.4, it has a Expensive valuation with a 0.6 Price to Book Value
Consistent Underperformance against the benchmark over the last 3 years
Stock DNA
Gems, Jewellery And Watches
INR 29 Cr (Micro Cap)
4.00
52
4.88%
-0.17
13.41%
0.58
Total Returns (Price + Dividend) 
Latest dividend: 0.1 per share ex-dividend date: Nov-07-2025
Risk Adjusted Returns v/s
Returns Beta

News

Deep Health AI India Ltd is Rated Strong Sell
Deep Health AI India Ltd is rated Strong Sell by MarketsMOJO. This rating was last updated on 11 February 2026. However, the analysis and financial metrics presented here reflect the stock's current position as of 09 July 2026, providing investors with the latest insights into the company’s performance and outlook.
Read full news article
Deep Health AI India Ltd is Rated Strong Sell
Deep Health AI India Ltd is rated Strong Sell by MarketsMOJO. This rating was last updated on 11 February 2026, reflecting a change from the previous 'Sell' grade. However, the analysis and financial metrics discussed here represent the stock's current position as of 19 June 2026, providing investors with the latest insights into its performance and outlook.
Read full news article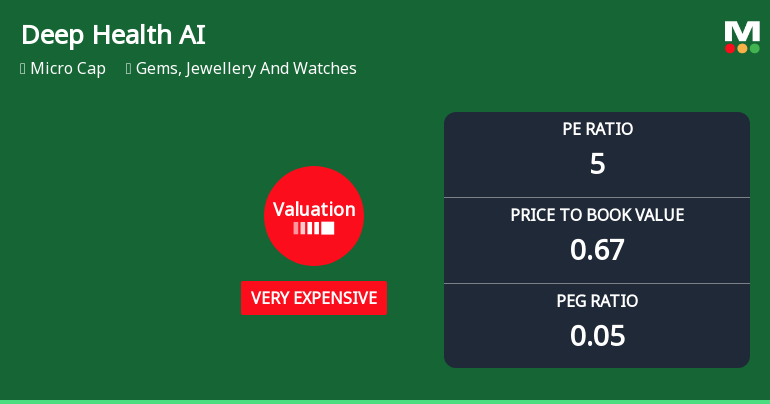
Deep Health AI India Ltd Valuation Shifts Signal Heightened Price Risk
Deep Health AI India Ltd, a micro-cap player in the Gems, Jewellery and Watches sector, has experienced a notable shift in its valuation parameters, moving from expensive to very expensive territory despite a challenging market backdrop and subdued returns relative to benchmarks like the Sensex.
Read full news article Announcements
Compliances-Certificate under Reg. 74 (5) of SEBI (DP) Regulations 2018
14-Jul-2026 | Source : BSEIn accordance with Regulation 74(5) of the SEBI (Depositories and Participants) Regulations 2018 for the quarter ended June 30 2026 based on the certificate received from M/s. MUFG Intime India Pvt Ltd. (RTA of the Company) which is enclosed herewith we hereby confirm in relation with the securities received for Dematerialization/Re-materialization that: a) The securities received from depository participants for Dematerialization/ Rematerialization were confirmed (accepted/ rejected) to the depositories; b) The securities comprised in the said Certificate(s) of Security have been listed on the Stock Exchanges; and c) The said Certificate (s) after due verification have been mutilated and cancelled and the name of the depository has been substituted in our records (i.e. in register of members) as the registered owner within stipulated time limit.
Clarification With Respect To Proposed Acquisition Of Land.
13-Jul-2026 | Source : BSEThis is to inform you that the Company had proposed the acquisition of land and in furtherance thereof entered into a Memorandum of Understanding (MoU) dated March 06 2026 with M/s. Elegant Floriculture & Agrotech (India) Limited for the proposed acquisition of land situated at Gat No. 358 Village Mouje Kashal Taluka - Maval District Pune - 412106 Maharashtra India admeasuring 49100 sq. mtr. Pursuant to the terms of the MoU the Company has made an aggregate advance payment of Rs. 28500000/- towards the proposed acquisition. The said amount was remitted in 10 tranches with the last tranche of the aforesaid advance payment being made on June 06 2026. The proposed acquisition is for the development of a naturopathy centre and a holistic rejuvenation centre including cultivation of medicinal plant species with a focus on organic and herb-based wellness and agro-tourism aimed at promoting preventive healthcare.
Clarification And Submission Of Revised Audit Report For The Financial Year Ended March 31 2026
13-Jul-2026 | Source : BSEThis is to inform you that the Board of Directors of the Company at its meeting held on May 29 2026 approved the Audited Standalone and Consolidated Financial Results for the financial year ended March 31 2026 which were duly submitted to the Stock Exchange. Subsequently it was observed that the Auditors Report forming part of the Audited Consolidated Financial Results inadvertently did not mention the names of the entities covered under the Consolidated Financial Statements as required in the report format. The omission was purely inadvertent and does not have any impact on the financial results or the audit opinion. Accordingly we are submitting herewith the revised Auditors Report incorporating the aforesaid details. We wish to clarify that there is no change in the Audited Standalone and Consolidated Financial Results as already submitted to the Stock Exchange.
Corporate Actions

No Upcoming Board Meetings

Deep Health AI India Ltd has declared 10% dividend, ex-date: 07 Nov 25

Deep Health AI India Ltd has announced 1:10 stock split, ex-date: 20 Jan 23

No Bonus history available

Deep Health AI India Ltd has announced 2:1 rights issue, ex-date: 29 Aug 25
Quality key factors
Valuation key factors
Technicals key factors
 Technical Indicator Scale: Bearish, Mildly Bearish, Sideways, Mildly Bullish, Bullish Turned
 Shareholding Snapshot : Jun 2026
Shareholding Compare (%holding)
Non Institution
None
Held by 0 Schemes
Held by 1 FIIs (0.35%)
Prakash Rikhabchand Solanki (0.01%)
None
97.64%
Quarterly Results Snapshot (Consolidated) - Mar'26 - YoY

YoY Growth in quarter ended Mar 2026 is -44.44% vs -73.53% in Mar 2025

YoY Growth in quarter ended Mar 2026 is -1,388.57% vs 369.23% in Mar 2025
Half Yearly Results Snapshot (Consolidated) - Sep'25
Growth in half year ended Sep 2025 is 332.10% vs -31.93% in Sep 2024
Growth in half year ended Sep 2025 is 430.61% vs 372.22% in Sep 2024
Nine Monthly Results Snapshot (Consolidated) - Dec'25
YoY Growth in nine months ended Dec 2025 is 393.83% vs -60.49% in Dec 2024
YoY Growth in nine months ended Dec 2025 is 964.15% vs 51.43% in Dec 2024
Annual Results Snapshot (Consolidated) - Mar'26
YoY Growth in year ended Mar 2026 is 237.30% vs -50.78% in Mar 2025
YoY Growth in year ended Mar 2026 is 28.41% vs 120.00% in Mar 2025
About Deep Health AI India Ltd

Company Coordinates


