
Compare Deep Health AI with Similar Stocks
Dashboard
Weak Long Term Fundamental Strength with an average Return on Equity (ROE) of 6.14%
- Company's ability to service its debt is weak with a poor EBIT to Interest (avg) ratio of 1.00
With ROE of 13.4, it has a Expensive valuation with a 0.6 Price to Book Value
Consistent Underperformance against the benchmark over the last 3 years
Stock DNA
Gems, Jewellery And Watches
INR 32 Cr (Micro Cap)
4.00
47
4.72%
-0.17
13.41%
0.59
Total Returns (Price + Dividend) 
Latest dividend: 0.1 per share ex-dividend date: Nov-07-2025
Risk Adjusted Returns v/s
Returns Beta

News

Deep Health AI India Ltd is Rated Strong Sell
Deep Health AI India Ltd is rated Strong Sell by MarketsMOJO. This rating was last updated on 11 February 2026, reflecting a change from the previous 'Sell' grade. However, the analysis and financial metrics discussed here represent the stock's current position as of 19 June 2026, providing investors with the latest insights into its performance and outlook.
Read full news article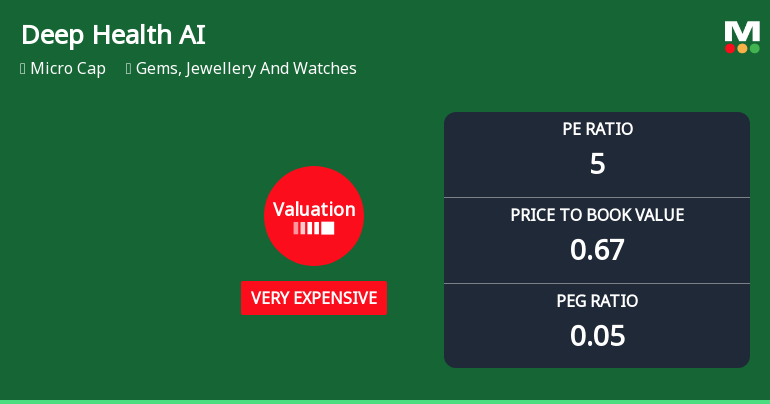
Deep Health AI India Ltd Valuation Shifts Signal Heightened Price Risk
Deep Health AI India Ltd, a micro-cap player in the Gems, Jewellery and Watches sector, has experienced a notable shift in its valuation parameters, moving from expensive to very expensive territory despite a challenging market backdrop and subdued returns relative to benchmarks like the Sensex.
Read full news article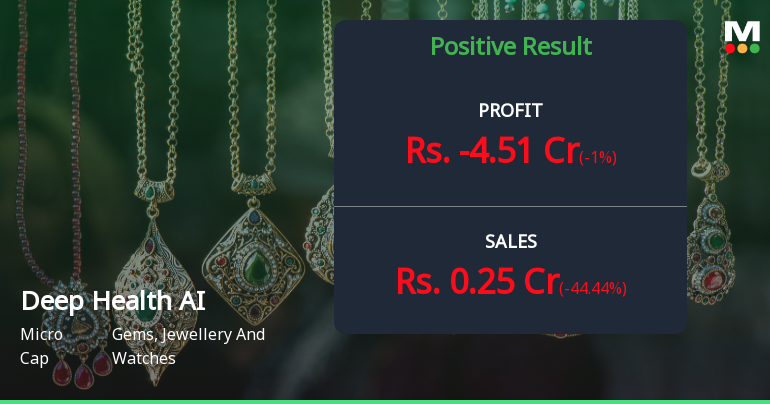
Deep Health AI India Q4 FY26: Severe Loss Triggers 78% Crash from Peak
Deep Health AI India Ltd., a micro-cap company operating in the gems and jewellery sector with recent forays into pharmaceutical consultancy, reported a devastating fourth quarter for FY26, posting a consolidated net loss of ₹4.51 crores compared to a profit of ₹0.35 crores in the same quarter last year. The catastrophic 1,388.57% year-on-year decline in profitability sent the stock tumbling to ₹2.21, down 78.52% from its 52-week high of ₹10.29, with the company's market capitalisation shrinking to just ₹34.00 crores.
Read full news article Announcements
Closure of Trading Window
26-Jun-2026 | Source : BSERespected Sir/Madam Pursuant to Securities and Exchange Board of Indi(Prohibition of Insider Trading) (Amendment) Regulations 2015 read with SEBI (Prohibition of Insider Trading)(Amendment)Regulations 2018 including the Second Amendment in the said Regulations dated July 25 2019 we wish to inform you that the Trading Window for dealing in equity shares of the Company shall remain closed from trading hours of July 01 2026 till 48 hours after the declaration of Un-Audited Financial Results for the Quarter ended June 30 2026 for all the Designated Persons and their Immediate Relatives.
Announcement under Regulation 30 (LODR)-Acquisition
25-Jun-2026 | Source : BSEPursuant to Regulation 30 of the SEBI (Listing Obligations and Disclosure Requirements) Regulations 2015 (SEBI Listing Regulations) we wish to inform that the Company has made acquisition of 06.37% each of the paid-up equity share capital of Leapfrog Engineering Services Ltd. the details of which are mentioned below in Annexure A respectively. We enclose herewith the details required under Regulation 30 of SEBI Listing Regulations and 1 of Para A of Part A of the Schedule III of the aforesaid regulation read with SEBI Circular No. HO/49/14/14(7)2025-CFD-POD2/I/3762/2026 dated January 30 2026 in Annexure to this letter.
Announcement under Regulation 30 (LODR)-Newspaper Publication
31-May-2026 | Source : BSEPursuant to Regulations 33 and 47 read with Schedule III of SEBI (Listing Obligations and Disclosures Requirements) Regulations 2015 please find enclosed a copy of the newspaper publication dated May 31 2026 in the following newspapers with respect to Audited Standalone and Consolidated Financial Results for the Quarter and Financial Year ended March 31 2026 approved at the meeting of Board of Directors held on Friday May 29 2026: 1. Prabhat Headline in English Language 2. Prabhat Abhinandan in Hindi Language
Corporate Actions

No Upcoming Board Meetings

Deep Health AI India Ltd has declared 10% dividend, ex-date: 07 Nov 25

Deep Health AI India Ltd has announced 1:10 stock split, ex-date: 20 Jan 23

No Bonus history available

Deep Health AI India Ltd has announced 2:1 rights issue, ex-date: 29 Aug 25
Quality key factors
Valuation key factors
Technicals key factors
 Technical Indicator Scale: Bearish, Mildly Bearish, Sideways, Mildly Bullish, Bullish Turned
 Shareholding Snapshot : Mar 2026
Shareholding Compare (%holding)
Non Institution
None
Held by 0 Schemes
Held by 1 FIIs (0.35%)
Prakash Rikhabchand Solanki (0.01%)
Vicky Rajesh Jhaveri (2.06%)
94.51%
Quarterly Results Snapshot (Consolidated) - Mar'26 - YoY

YoY Growth in quarter ended Mar 2026 is -44.44% vs -73.53% in Mar 2025

YoY Growth in quarter ended Mar 2026 is -1,388.57% vs 369.23% in Mar 2025
Half Yearly Results Snapshot (Consolidated) - Sep'25
Growth in half year ended Sep 2025 is 332.10% vs -31.93% in Sep 2024
Growth in half year ended Sep 2025 is 430.61% vs 372.22% in Sep 2024
Nine Monthly Results Snapshot (Consolidated) - Dec'25
YoY Growth in nine months ended Dec 2025 is 393.83% vs -60.49% in Dec 2024
YoY Growth in nine months ended Dec 2025 is 964.15% vs 51.43% in Dec 2024
Annual Results Snapshot (Consolidated) - Mar'26
YoY Growth in year ended Mar 2026 is 237.30% vs -50.78% in Mar 2025
YoY Growth in year ended Mar 2026 is 28.41% vs 120.00% in Mar 2025
About Deep Health AI India Ltd

Company Coordinates


