
Compare Deep Industries with Similar Stocks
Total Returns (Price + Dividend) 
Latest dividend: 3.05 per share ex-dividend date: Aug-22-2025
Risk Adjusted Returns v/s
Returns Beta

News

Deep Industries Ltd is Rated Buy
Deep Industries Ltd is rated Buy by MarketsMOJO, with this rating last updated on 04 June 2026. However, the analysis and financial metrics discussed here reflect the company’s current position as of 09 June 2026, providing investors with the most up-to-date insight into the stock’s fundamentals, returns, and technical outlook.
Read full news article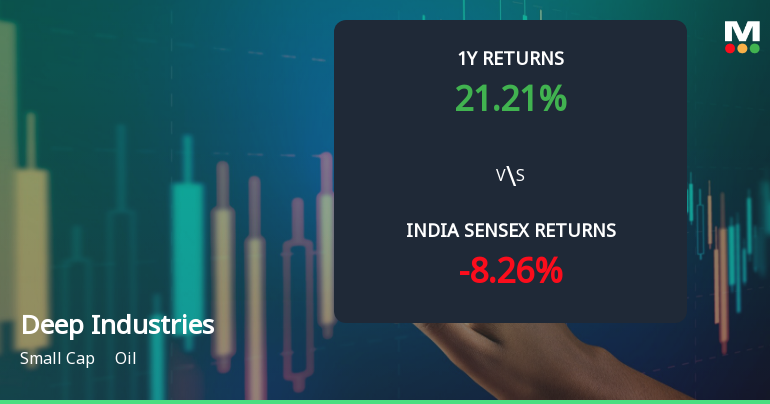
Deep Industries Ltd Shifts to Bullish Momentum Amid Technical Indicator Improvements
Deep Industries Ltd has demonstrated a significant shift in price momentum, moving from a sideways trend to a bullish stance, supported by a range of technical indicators. Despite some mixed signals on monthly charts, the stock’s recent performance and technical parameters suggest a cautiously optimistic outlook for investors in the oil sector.
Read full news article
Golden Cross Confirmed: Do Deep Industries Ltd's Other Technical Indicators Agree?
The 50-day moving average has crossed above the 200-day moving average for Deep Industries Ltd, signalling a golden cross on 2 Jun 2026. Yet, the broader technical picture presents a nuanced view, with some monthly indicators mildly bearish despite strong weekly momentum — does this divergence suggest caution in interpreting the crossover?
Read full news article Announcements
Announcement under Regulation 30 (LODR)-Earnings Call Transcript
21-May-2026 | Source : BSETranscript of earning call held to discuss annual financial result for quarter and financial year ended on 31st march 2026.
Announcement under Regulation 30 (LODR)-Newspaper Publication
18-May-2026 | Source : BSENewspaper Advertisement
Announcement under Regulation 30 (LODR)-Analyst / Investor Meet - Outcome
15-May-2026 | Source : BSEAudio Link of the earnings call held today; May 15 2026
Corporate Actions

No Upcoming Board Meetings

Deep Industries Ltd has declared 61% dividend, ex-date: 22 Aug 25

Deep Industries Ltd has announced 5:10 stock split, ex-date: 10 Apr 23

No Bonus history available

No Rights history available
Quality key factors
Valuation key factors
Technicals key factors
 Technical Indicator Scale: Bearish, Mildly Bearish, Sideways, Mildly Bullish, Bullish Turned
 Shareholding Snapshot : Mar 2026
Shareholding Compare (%holding)
Promoters
None
Held by 1 Schemes (0.09%)
Held by 39 FIIs (1.81%)
Rupesh Savla Family Trust (31.49%)
Monit Exim Llp (3.71%)
22.23%
Quarterly Results Snapshot (Consolidated) - Mar'26 - QoQ

QoQ Growth in quarter ended Mar 2026 is 12.28% vs 0.22% in Dec 2025

QoQ Growth in quarter ended Mar 2026 is -121.10% vs 0.96% in Dec 2025
Half Yearly Results Snapshot (Consolidated) - Sep'25
Growth in half year ended Sep 2025 is 65.51% vs 25.38% in Sep 2024
Growth in half year ended Sep 2025 is 67.27% vs 24.62% in Sep 2024
Nine Monthly Results Snapshot (Consolidated) - Dec'25
YoY Growth in nine months ended Dec 2025 is 57.01% vs 33.05% in Dec 2024
YoY Growth in nine months ended Dec 2025 is 63.17% vs 35.73% in Dec 2024
Annual Results Snapshot (Consolidated) - Mar'26
YoY Growth in year ended Mar 2026 is 54.60% vs 34.93% in Mar 2025
YoY Growth in year ended Mar 2026 is 299.71% vs -172.75% in Mar 2025
About Deep Industries Ltd

Company Coordinates


