
Compare Deepak Fertilis. with Similar Stocks
Stock DNA
Fertilizers
INR 19,446 Cr (Small Cap)
27.00
23
0.66%
0.73
10.77%
2.79
Total Returns (Price + Dividend) 
Latest dividend: 10 per share ex-dividend date: Sep-02-2025
Risk Adjusted Returns v/s
Returns Beta

News
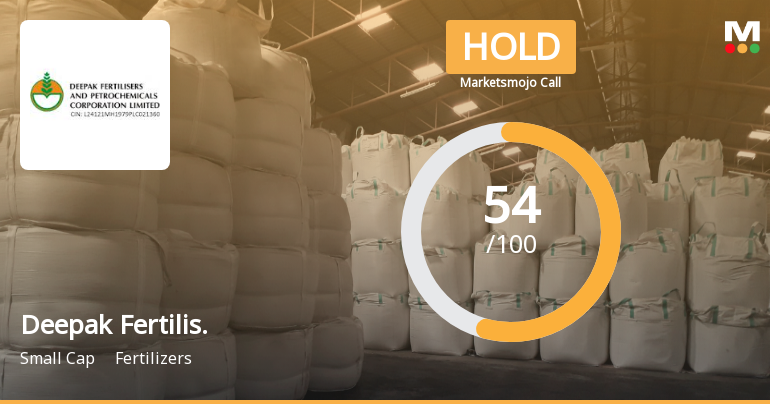
Deepak Fertilisers & Petrochemicals Corp Ltd Upgraded to Hold Amid Mixed Financial and Technical Signals
Deepak Fertilisers & Petrochemicals Corp Ltd has seen its investment rating upgraded from Sell to Hold, reflecting a nuanced improvement across technical indicators, valuation metrics, and management efficiency despite recent financial setbacks. This shift highlights a cautiously optimistic outlook amid mixed signals from the company’s quarterly performance and market trends.
Read full news article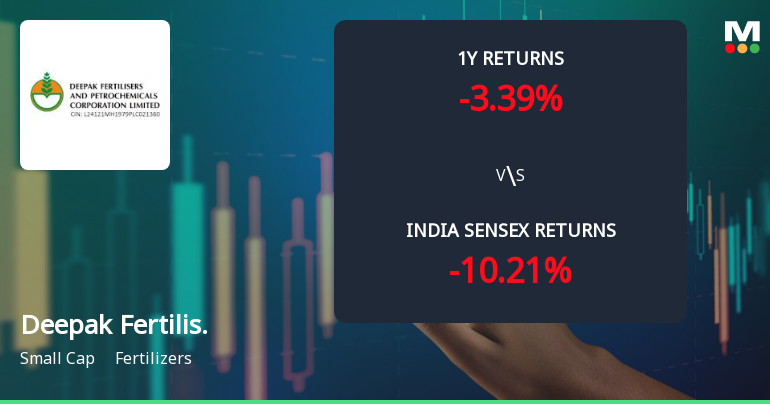
Deepak Fertilisers & Petrochemicals Corp Ltd Shows Mixed Technical Signals Amid Mildly Bullish Momentum
Deepak Fertilisers & Petrochemicals Corp Ltd (Deepak Fertilisers) has experienced a notable shift in its technical momentum, moving from a sideways trend to a mildly bullish stance. Despite a 1.57% decline in the latest session to close at ₹1,494.10, the stock’s technical indicators present a nuanced picture, reflecting both bullish and bearish signals across weekly and monthly timeframes. This article analyses the recent technical developments, price momentum, and relative performance against the Sensex to provide a comprehensive view for investors.
Read full news article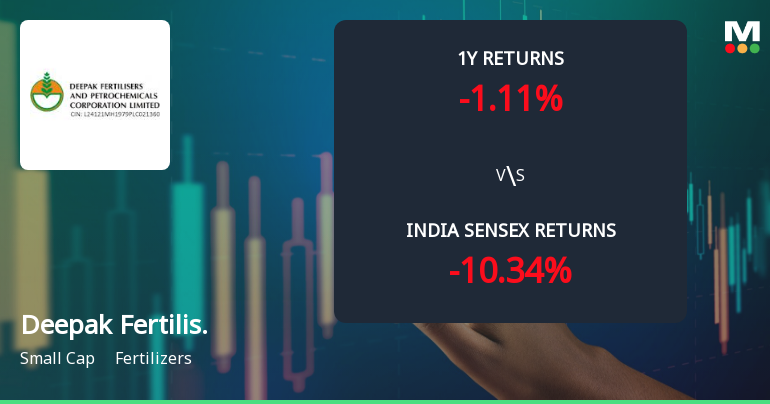
Deepak Fertilisers & Petrochemicals Corp Ltd Sees Mixed Technical Signals Amid Price Momentum Shift
Deepak Fertilisers & Petrochemicals Corp Ltd (DFPCL) has experienced a notable shift in its price momentum and technical indicators, reflecting a complex market sentiment. Despite a strong weekly price gain of 4.50% to close at ₹1,517.90 on 10 Jun 2026, the stock’s technical parameters present a nuanced picture, with bullish signals on some fronts and bearish tendencies on others. This article analyses the recent technical developments, placing them in the context of broader market trends and the company’s performance relative to the Sensex.
Read full news article Announcements
Announcement under Regulation 30 (LODR)-Earnings Call Transcript
01-Jun-2026 | Source : BSEManagement Transcript of Q4 FY 2026 Earnings Conference Call
Announcement under Regulation 30 (LODR)-Analyst / Investor Meet - Outcome
29-May-2026 | Source : BSESubmission of Audio recording of earnings call held today i.e. 29th May 2026 for discussion of financial results for quarter and year ended 31st March 2026
Announcement under Regulation 30 (LODR)-Newspaper Publication
29-May-2026 | Source : BSEIntimation of newspaper publication.
Corporate Actions

No Upcoming Board Meetings

Deepak Fertilisers & Petrochemicals Corp Ltd has declared 100% dividend, ex-date: 02 Sep 25

No Splits history available

No Bonus history available

Deepak Fertilisers & Petrochemicals Corp Ltd has announced 3:20 rights issue, ex-date: 16 Sep 20
Quality key factors
Valuation key factors
Technicals key factors
 Technical Indicator Scale: Bearish, Mildly Bearish, Sideways, Mildly Bullish, Bullish Turned
 Shareholding Snapshot : Mar 2026
Shareholding Compare (%holding)
Promoters
5.0431
Held by 21 Schemes (9.58%)
Held by 141 FIIs (10.31%)
Nova Synthetic Private Limited (34.53%)
Sbi Small Cap Fund (5.25%)
24.27%
Quarterly Results Snapshot (Consolidated) - Mar'26 - QoQ

QoQ Growth in quarter ended Mar 2026 is 6.41% vs -5.85% in Dec 2025
QoQ Growth in quarter ended Mar 2026 is -1.48% vs -33.64% in Dec 2025
Half Yearly Results Snapshot (Consolidated) - Sep'25
Growth in half year ended Sep 2025 is 12.66% vs 6.14% in Sep 2024

Growth in half year ended Sep 2025 is 12.51% vs 138.39% in Sep 2024
Nine Monthly Results Snapshot (Consolidated) - Dec'25
YoY Growth in nine months ended Dec 2025 is 11.67% vs 15.44% in Dec 2024
YoY Growth in nine months ended Dec 2025 is -8.91% vs 188.23% in Dec 2024
Annual Results Snapshot (Consolidated) - Mar'26
YoY Growth in year ended Mar 2026 is 11.99% vs 18.42% in Mar 2025
YoY Growth in year ended Mar 2026 is -21.03% vs 106.16% in Mar 2025
About Deepak Fertilisers & Petrochemicals Corp Ltd

Company Coordinates


