
Compare Deere & Co. with Similar Stocks
Dashboard
The company has declared Negative results for the last 4 consecutive quarters
- NET SALES(9M) At USD 33,291 MM has Grown at -17.95%
- NET PROFIT(HY) At USD 3,022.22 MM has Grown at -26.01%
- ROCE(HY) Lowest at 21.59%
With ROCE of 12.69%, it has a very expensive valuation with a 3.88 Enterprise value to Capital Employed
Total Returns (Price + Dividend) 
Deere & Co. for the last several years.
Risk Adjusted Returns v/s
News

Deere & Co. Experiences Revision in Stock Evaluation Amid Mixed Market Performance
Deere & Co. has recently revised its evaluation amid changing market conditions, with its stock priced at $464.49. The company has experienced a significant range in stock performance over the past year. Technical indicators show mixed trends, reflecting both challenges and opportunities in the current market landscape.
Read full news article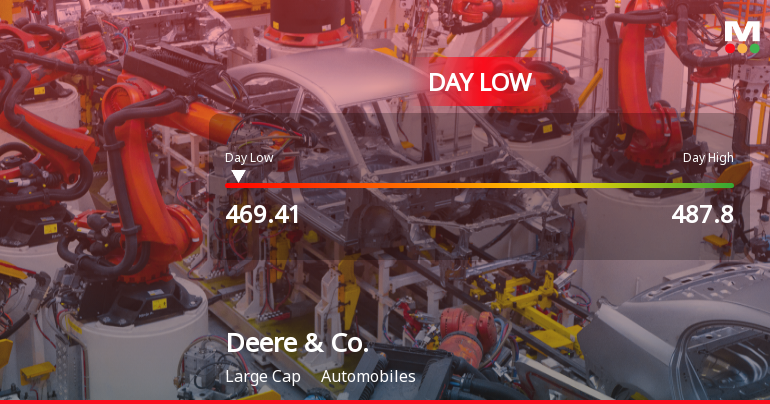
Deere & Co. Hits Day Low of $469.41 Amid Price Pressure
Deere & Co. faced a notable decline in stock performance, reflecting ongoing market challenges. Over the past week and month, the company's stock has underperformed compared to the S&P 500. Financial metrics reveal significant decreases in net sales and profit, highlighting the difficulties the company is currently experiencing.
Read full news article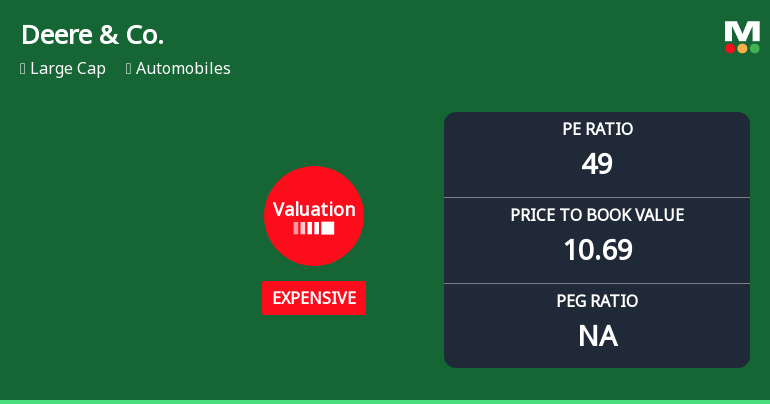
Deere & Co. Experiences Valuation Adjustment Amid Strong Market Position and Performance Metrics
Deere & Co. has recently adjusted its valuation metrics, reporting a P/E ratio of 49 and a price-to-book value of 10.69. The company maintains a solid return on capital employed of 12.69% and a return on equity of 21.95%, reflecting its competitive standing in the industry.
Read full news article Announcements

Corporate Actions
Quality key factors
Valuation key factors
Technicals key factors
 Technical Indicator Scale: Bearish, Mildly Bearish, Sideways, Mildly Bullish, Bullish Turned
 Shareholding Snapshot : Oct 2025
Shareholding Compare (%holding)
Domestic Funds
Held in 205 Schemes (30.22%)
Held by 585 Foreign Institutions (14.96%)
Quarterly Results Snapshot (Consolidated) - Oct'25 - YoY

YoY Growth in quarter ended Oct 2025 is 11.21% vs -27.70% in Oct 2024
YoY Growth in quarter ended Oct 2025 is -14.65% vs -47.55% in Oct 2024
Annual Results Snapshot (Consolidated) - Oct'25
YoY Growth in year ended Oct 2025 is -11.55% vs -15.73% in Oct 2024
YoY Growth in year ended Oct 2025 is -29.49% vs -30.20% in Oct 2024
About Deere & Co.

Company Coordinates


