
Compare DENSO Corp. with Similar Stocks
Dashboard
Poor Management Efficiency with a low ROE of 6.90%
- The company has been able to generate a Return on Equity (avg) of 6.90% signifying low profitability per unit of shareholders funds
Company's ability to service its debt is strong with a healthy EBIT to Interest (avg) ratio of 29.69
Low Debt Company with Strong Long Term Fundamental Strength
Negative results in Jun 25
With ROE of 9.35%, it has a very attractive valuation with a 1.11 Price to Book Value
Underperformed the market in the last 1 year
Stock DNA
Auto Components & Equipments
JPY 6,353,213 Million (Large Cap)
12.00
NA
0.00%
-0.06
9.39%
1.32
Total Returns (Price + Dividend) 
DENSO Corp. for the last several years.
Risk Adjusted Returns v/s
News
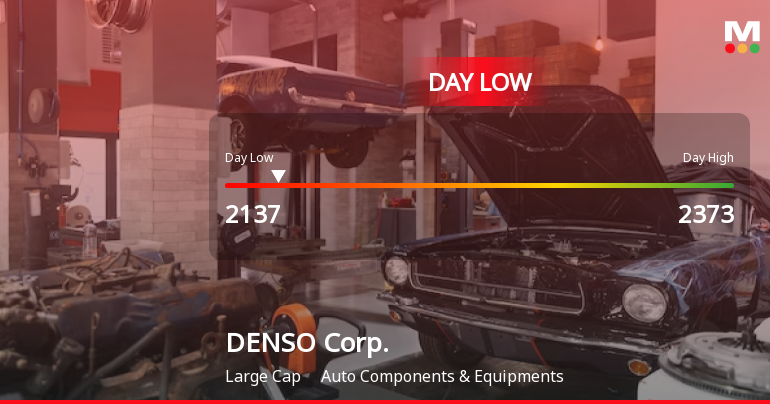
DENSO Corp. Stock Hits Day Low Amid Price Pressure, Closes at JPY 2,137.00
DENSO Corp. faced a notable stock decline today, reflecting ongoing market challenges. Despite a year-over-year profit increase, the company's return on equity indicates low profitability. DENSO's debt management appears strong, yet its long-term performance has significantly lagged behind the Japan Nikkei 225, raising concerns among stakeholders.
Read full news article Announcements

Corporate Actions
Quality key factors
Valuation key factors
Technicals key factors
 Technical Indicator Scale: Bearish, Mildly Bearish, Sideways, Mildly Bullish, Bullish Turned
 Shareholding Snapshot : Mar 2025
Shareholding Compare (%holding)
Foreign Institutions
Held in 0 Schemes (0%)
Held by 1 Foreign Institutions (0.0%)
Quarterly Results Snapshot (Consolidated) - Jun'25 - QoQ

QoQ Growth in quarter ended Jun 2025 is -6.36% vs 3.29% in Mar 2025
QoQ Growth in quarter ended Jun 2025 is -30.28% vs -3.61% in Mar 2025
Annual Results Snapshot (Consolidated) - Mar'25
YoY Growth in year ended Mar 2025 is 0.24% vs 11.61% in Mar 2024

YoY Growth in year ended Mar 2025 is 30.85% vs 2.22% in Mar 2024
About DENSO Corp.

Company Coordinates


