
Compare Denta Water with Similar Stocks
Dashboard
Poor long term growth as Operating profit has grown by an annual rate -3.04% of over the last 5 years
Negative results in Mar 26
With ROE of 13.3, it has a Expensive valuation with a 2 Price to Book Value
Despite the size of the company, domestic mutual funds hold only 0% of the company
Stock DNA
Other Utilities
INR 930 Cr (Micro Cap)
15.00
39
0.77%
-0.17
13.27%
1.89
Total Returns (Price + Dividend) 
Latest dividend: 2.514852220406951 per share ex-dividend date: Aug-14-2025
Risk Adjusted Returns v/s
Returns Beta

News
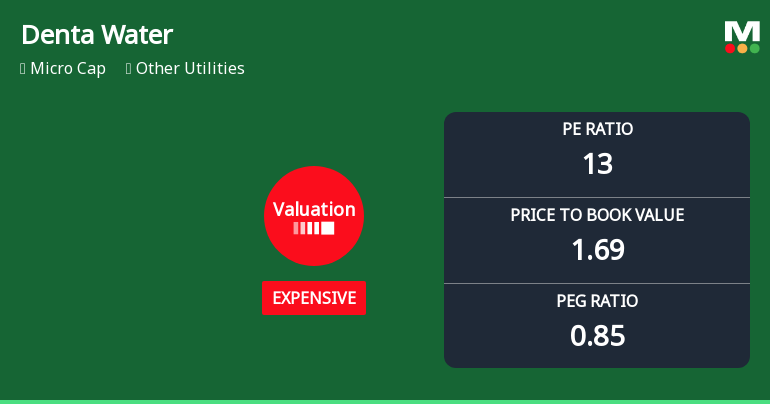
Denta Water & Infra Solutions Ltd: Valuation Shift Signals Price Attractiveness Change
Denta Water & Infra Solutions Ltd has experienced a notable shift in its valuation parameters, moving from a fair to an expensive rating. This change, reflected in key metrics such as the price-to-earnings (P/E) and price-to-book value (P/BV) ratios, signals a transformation in the stock’s price attractiveness relative to its historical averages and peer group. Investors should carefully analyse these developments amid the company’s recent market performance and sector dynamics.
Read full news article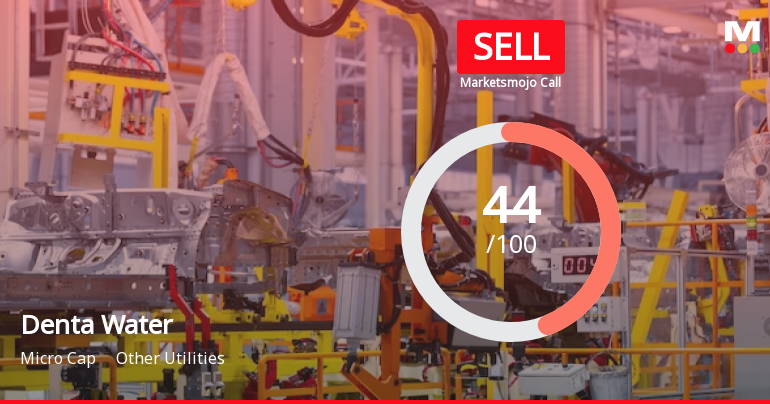
Denta Water & Infra Solutions Ltd is Rated Sell
Denta Water & Infra Solutions Ltd is rated 'Sell' by MarketsMOJO, with this rating last updated on 13 Feb 2026. However, the analysis and financial metrics discussed here reflect the stock's current position as of 21 June 2026, providing investors with an up-to-date view of its fundamentals, returns, and overall outlook.
Read full news article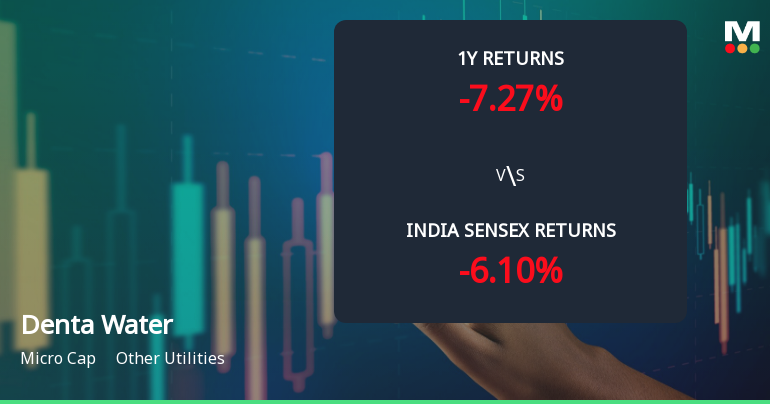
Denta Water & Infra Solutions Ltd Sees Technical Momentum Shift Amid Mixed Returns
Denta Water & Infra Solutions Ltd, a micro-cap player in the Other Utilities sector, has experienced a notable shift in its technical momentum, moving from a mildly bearish stance to a mildly bullish one. Despite this positive technical transition, the company’s overall MarketsMOJO grade has been downgraded from Hold to Sell, reflecting a cautious outlook amid mixed indicator signals and subdued longer-term returns compared to the broader market.
Read full news article Announcements
Clarification sought from Denta Water and Infra Solutions Ltd
17-Jun-2026 | Source : BSEThe Exchange has sought clarification from Denta Water and Infra Solutions Ltd on June 17 2026 with reference to Movement in Volume.
The reply is awaited.
Clarification On Volume Movement Letter Dated June 17 2026
17-Jun-2026 | Source : BSEClarification on Volume Movement
Updates On Earnings Conference Call
11-Jun-2026 | Source : BSEUpdate on Earnings call
Corporate Actions

No Upcoming Board Meetings

Denta Water & Infra Solutions Ltd has declared 25% dividend, ex-date: 14 Aug 25

No Splits history available

No Bonus history available

No Rights history available
Quality key factors
Valuation key factors
Technicals key factors
 Technical Indicator Scale: Bearish, Mildly Bearish, Sideways, Mildly Bullish, Bullish Turned
 Shareholding Snapshot : Mar 2026
Shareholding Compare (%holding)
Promoters
None
Held by 0 Schemes
Held by 1 FIIs (0.01%)
Sowbhagyamma (25.17%)
None
24.62%
Quarterly Results Snapshot (Consolidated) - Mar'26 - QoQ

QoQ Growth in quarter ended Mar 2026 is 3.34% vs -27.94% in Dec 2025

QoQ Growth in quarter ended Mar 2026 is -36.34% vs -24.41% in Dec 2025
Half Yearly Results Snapshot (Standalone) - Sep'25
Not Applicable: The company has declared_date for only one period
Not Applicable: The company has declared_date for only one period
Nine Monthly Results Snapshot (Standalone) - Dec'25
Not Applicable: The company has declared_date for only one period
Not Applicable: The company has declared_date for only one period
Annual Results Snapshot (Consolidated) - Mar'26
YoY Growth in year ended Mar 2026 is 23.16% vs -14.80% in Mar 2025
YoY Growth in year ended Mar 2026 is 15.14% vs -12.54% in Mar 2025
About Denta Water & Infra Solutions Ltd

Company Coordinates


