
Compare Dev Information with Similar Stocks
Stock DNA
Computers - Software & Consulting
INR 160 Cr (Micro Cap)
28.00
20
0.36%
0.22
5.12%
1.42
Total Returns (Price + Dividend) 
Latest dividend: 0.10077276020284956 per share ex-dividend date: Sep-23-2025
Risk Adjusted Returns v/s
Returns Beta

News

Dev Information Technology Ltd Downgraded to Strong Sell Amid Deteriorating Fundamentals and Technicals
Dev Information Technology Ltd has been downgraded from a Sell to a Strong Sell rating as of 12 June 2026, reflecting deteriorating fundamentals and increasingly negative technical indicators. The micro-cap software and consulting firm has seen a marked decline in financial performance, promoter confidence, and technical momentum, prompting a reassessment of its investment appeal.
Read full news article
Dev Information Technology Ltd is Rated Strong Sell
Dev Information Technology Ltd is rated Strong Sell by MarketsMOJO, with this rating last updated on 12 June 2026. However, the analysis and financial metrics discussed here reflect the company’s current position as of 14 June 2026, providing investors with the latest insights into the stock’s performance and outlook.
Read full news article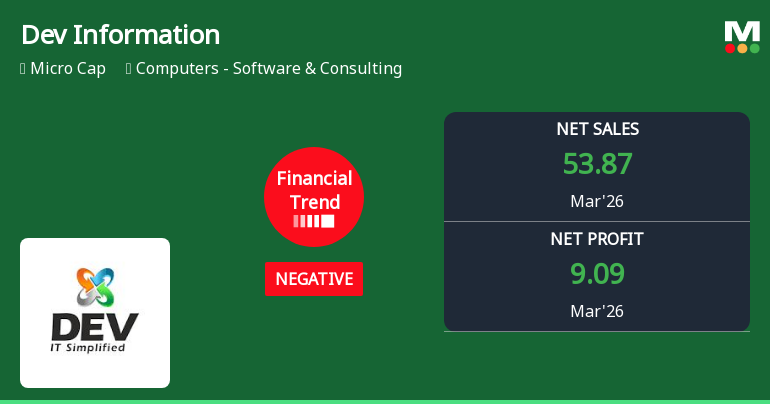
Dev Information Technology Ltd Reports Mixed Quarterly Results Amid Negative Financial Trend
Dev Information Technology Ltd, a micro-cap player in the Computers - Software & Consulting sector, has reported its quarterly results for March 2026, reflecting a complex financial picture. While the company achieved record net sales and profit after tax (PAT) for the quarter, several key financial indicators reveal ongoing challenges, signalling a shift from a previously flat to a negative financial trend.
Read full news article Announcements
Dev Information Technology Limited - Clarification
03-Dec-2019 | Source : NSEDev Information Technology Limited with respect to announcement dated 14-Nov-2019, regardingá Resignation of Mr Hiren Karsanbhai Patel as Non- Executive Independent Director of the company w.e.f. November 14, 2019.
Dev Information Technology Limited - Outcome of Board Meeting
15-Nov-2019 | Source : NSEDev Information Technology Limited has informed the Exchange regarding Board meeting held on November 14, 2019.
Dev Information Technology Limited - Credit Rating
25-Oct-2019 | Source : NSEDev Information Technology Limited has informed the Exchange regarding Credit Rating
Corporate Actions

No Upcoming Board Meetings

Dev Information Technology Ltd has declared 5% dividend, ex-date: 23 Sep 25

Dev Information Technology Ltd has announced 2:5 stock split, ex-date: 21 Aug 25

No Bonus history available

No Rights history available
Quality key factors
Valuation key factors
Technicals key factors
 Technical Indicator Scale: Bearish, Mildly Bearish, Sideways, Mildly Bullish, Bullish Turned
 Shareholding Snapshot : Mar 2026
Shareholding Compare (%holding)
Non Institution
None
Held by 0 Schemes
Held by 2 FIIs (0.33%)
Pranav Niranjan Pandya Huf . (7.45%)
Xduce Technologies Private Limited (23.95%)
27.04%
Quarterly Results Snapshot (Consolidated) - Mar'26 - YoY

YoY Growth in quarter ended Mar 2026 is 4.50% vs 18.67% in Mar 2025

YoY Growth in quarter ended Mar 2026 is 645.08% vs -70.53% in Mar 2025
Half Yearly Results Snapshot (Consolidated) - Sep'25
Growth in half year ended Sep 2025 is 28.14% vs -19.23% in Sep 2024
Growth in half year ended Sep 2025 is 520.47% vs 245.51% in Sep 2024
Nine Monthly Results Snapshot (Consolidated) - Dec'25
YoY Growth in nine months ended Dec 2025 is 13.87% vs -0.86% in Dec 2024
YoY Growth in nine months ended Dec 2025 is 388.57% vs 165.05% in Dec 2024
Annual Results Snapshot (Consolidated) - Mar'26
YoY Growth in year ended Mar 2026 is 11.04% vs 4.33% in Mar 2025
YoY Growth in year ended Mar 2026 is 409.62% vs 60.06% in Mar 2025
About Dev Information Technology Ltd

Company Coordinates


