
Compare Devyani Intl. with Similar Stocks
Dashboard
Weak Long Term Fundamental Strength with a -6.04% CAGR growth in Operating Profits over the last 5 years
- Low ability to service debt as the company has a high Debt to EBITDA ratio of 4.51 times
- The company has been able to generate a Return on Capital Employed (avg) of 8.64% signifying low profitability per unit of total capital (equity and debt)
Flat results in Mar 26
With ROCE of 4, it has a Expensive valuation with a 3.4 Enterprise value to Capital Employed
Consistent Underperformance against the benchmark over the last 3 years
Stock DNA
Leisure Services
INR 13,458 Cr (Small Cap)
NA (Loss Making)
NA
0.00%
2.17
-1.11%
8.54
Total Returns (Price + Dividend) 
Devyani Intl. for the last several years.
Risk Adjusted Returns v/s
Returns Beta

News

Devyani International Ltd Faces Intensified Downtrend Amid Technical Weakness
Devyani International Ltd, a small-cap player in the Leisure Services sector, has experienced a notable shift in price momentum, with technical indicators signalling a deteriorating outlook. The company’s shares closed at ₹109.45 on 11 Jun 2026, down 1.57% from the previous close of ₹111.20, reflecting growing bearish sentiment amid weakening technical trends.
Read full news article
Devyani International Ltd Technical Momentum Shifts Amid Bearish Sentiment
Devyani International Ltd, a small-cap player in the Leisure Services sector, has experienced a nuanced shift in its technical momentum, reflecting a complex interplay of bearish and mildly bullish signals. Despite a modest day gain of 0.68%, the stock’s broader technical indicators reveal a cautious outlook amid persistent downward pressure.
Read full news article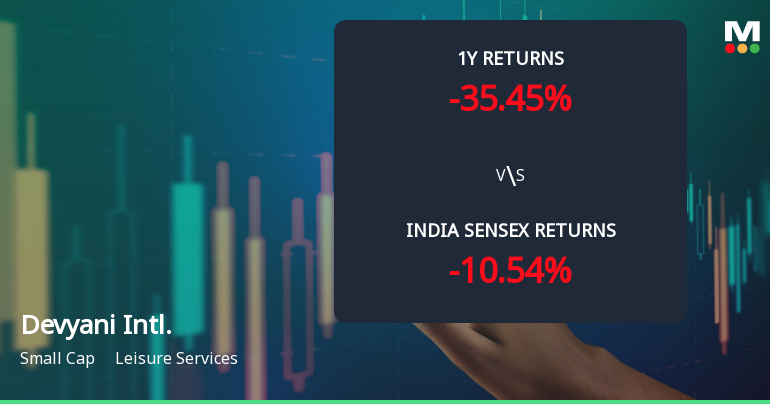
Devyani International Ltd Faces Intensified Downtrend Amid Technical Weakness
Devyani International Ltd, a small-cap player in the Leisure Services sector, has experienced a marked shift in its technical momentum, with multiple indicators signalling a deepening bearish trend. The company’s stock price has declined by 2.39% today to ₹110.45, continuing a downward trajectory that has seen significant underperformance relative to the broader market benchmarks such as the Sensex.
Read full news article Announcements
Announcement under Regulation 30 (LODR)-Analyst / Investor Meet - Intimation
26-May-2026 | Source : BSEParticipation of Representatives of the Company in Event(s)/ Conference(s)
Announcement under Regulation 30 (LODR)-Earnings Call Transcript
21-May-2026 | Source : BSETranscript
Announcement under Regulation 30 (LODR)-Newspaper Publication
16-May-2026 | Source : BSENewspaper Publication
Corporate Actions

No Upcoming Board Meetings

No Dividend history available

No Splits history available

No Bonus history available

No Rights history available
Quality key factors
Valuation key factors
Technicals key factors
 Technical Indicator Scale: Bearish, Mildly Bearish, Sideways, Mildly Bullish, Bullish Turned
 Shareholding Snapshot : Mar 2026
Shareholding Compare (%holding)
Promoters
0.0005
Held by 25 Schemes (15.36%)
Held by 109 FIIs (6.13%)
Rj Corp Limited (57.98%)
Nippon Life India Trustee Ltd- A/c Nippon India Gr (6.35%)
5.3%
Quarterly Results Snapshot (Consolidated) - Mar'26 - QoQ

QoQ Growth in quarter ended Mar 2026 is -0.28% vs 4.66% in Dec 2025
QoQ Growth in quarter ended Mar 2026 is 3.37% vs 52.54% in Dec 2025
Half Yearly Results Snapshot (Consolidated) - Sep'25
Growth in half year ended Sep 2025 is 11.85% vs 46.69% in Sep 2024
Growth in half year ended Sep 2025 is -174.65% vs -45.95% in Sep 2024
Nine Monthly Results Snapshot (Consolidated) - Dec'25
YoY Growth in nine months ended Dec 2025 is 11.67% vs 48.99% in Dec 2024
YoY Growth in nine months ended Dec 2025 is -219.67% vs -56.35% in Dec 2024
Annual Results Snapshot (Consolidated) - Mar'26
YoY Growth in year ended Mar 2026 is 13.34% vs 39.22% in Mar 2025
YoY Growth in year ended Mar 2026 is -522.19% vs -80.64% in Mar 2025
About Devyani International Ltd

Company Coordinates


