
Compare Devyani Intl. with Similar Stocks
Dashboard
Weak Long Term Fundamental Strength with a -6.04% CAGR growth in Operating Profits over the last 5 years
- Low ability to service debt as the company has a high Debt to EBITDA ratio of 4.51 times
- The company has been able to generate a Return on Capital Employed (avg) of 8.64% signifying low profitability per unit of total capital (equity and debt)
Flat results in Mar 26
With ROCE of 4, it has a Expensive valuation with a 3.6 Enterprise value to Capital Employed
Consistent Underperformance against the benchmark over the last 3 years
Stock DNA
Leisure Services
INR 14,592 Cr (Small Cap)
NA (Loss Making)
46
0.00%
2.17
-1.11%
9.12
Total Returns (Price + Dividend) 
Devyani Intl. for the last several years.
Risk Adjusted Returns v/s
Returns Beta

News
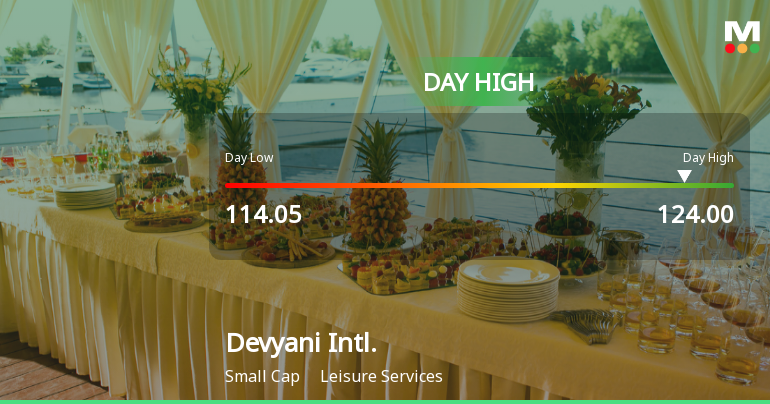
Devyani International Ltd Surges 8.14% to Day's High of Rs 121.45 — Outperforms Sector by 5.44 Percentage Points
The Sensex advanced 1.07% on 29 Jul 2026, yet Devyani International Ltd outpaced the broader market with an 8.14% gain, touching an intraday high of Rs 121.45. This 5.44 percentage-point outperformance over its Leisure Services sector peers marks a notable single-session surge that demands a closer look at the underlying technical and market context.
Read full news article
Devyani International Ltd is Rated Strong Sell
Devyani International Ltd is rated Strong Sell by MarketsMOJO, with this rating last updated on 07 Nov 2025. However, the analysis and financial metrics discussed here reflect the company’s current position as of 27 July 2026, providing investors with the latest insights into its performance and outlook.
Read full news article Announcements
Announcement under Regulation 30 (LODR)-Newspaper Publication
24-Jul-2026 | Source : BSENewspaper publication dated July 24 2026
Notice Of 35Th Annual General Meeting And Annual Report Of FY 2025-26
23-Jul-2026 | Source : BSENotice of 35th Annual General Meeting and Annual Report of FY 2025-26
Business Responsibility and Sustainability Reporting (BRSR)
23-Jul-2026 | Source : BSEBusiness Responsibility and Sustainability Report for FY 2025-26
Corporate Actions

(29 Jul 2026)

No Dividend history available

No Splits history available

No Bonus history available

No Rights history available
Quality key factors
Valuation key factors
Technicals key factors
 Technical Indicator Scale: Bearish, Mildly Bearish, Sideways, Mildly Bullish, Bullish Turned
 Shareholding Snapshot : Jun 2026
Shareholding Compare (%holding)
Promoters
0.0005
Held by 24 Schemes (15.26%)
Held by 111 FIIs (6.81%)
Rj Corp Limited (57.98%)
Nippon Life India Trustee Ltd-a/c Nippon India Nif (7.06%)
5.72%
Quarterly Results Snapshot (Consolidated) - Mar'26 - QoQ

QoQ Growth in quarter ended Mar 2026 is -0.28% vs 4.66% in Dec 2025
QoQ Growth in quarter ended Mar 2026 is 3.37% vs 52.54% in Dec 2025
Half Yearly Results Snapshot (Consolidated) - Sep'25
Growth in half year ended Sep 2025 is 11.85% vs 46.69% in Sep 2024
Growth in half year ended Sep 2025 is -174.65% vs -45.95% in Sep 2024
Nine Monthly Results Snapshot (Consolidated) - Dec'25
YoY Growth in nine months ended Dec 2025 is 11.67% vs 48.99% in Dec 2024
YoY Growth in nine months ended Dec 2025 is -219.67% vs -56.35% in Dec 2024
Annual Results Snapshot (Consolidated) - Mar'26
YoY Growth in year ended Mar 2026 is 13.34% vs 39.22% in Mar 2025
YoY Growth in year ended Mar 2026 is -522.19% vs -80.64% in Mar 2025
About Devyani International Ltd

Company Coordinates


