
Compare Dhabriya Poly. with Similar Stocks
Dashboard
High Management Efficiency with a high ROCE of 16.50%
Healthy long term growth as Operating profit has grown by an annual rate 34.75%
With a growth in Net Profit of 55.12%, the company declared Very Positive results in Mar 26
With ROCE of 22.3, it has a Very Attractive valuation with a 2.2 Enterprise value to Capital Employed
Majority shareholders : Promoters
Stock DNA
Plastic Products - Industrial
INR 381 Cr (Micro Cap)
12.00
35
0.20%
0.54
23.25%
2.90
Total Returns (Price + Dividend) 
Latest dividend: 0.7 per share ex-dividend date: Sep-23-2025
Risk Adjusted Returns v/s
Returns Beta

News
Dhabriya Polywood Ltd Downgraded to Hold Amid Mixed Technical and Valuation Signals
Dhabriya Polywood Ltd, a micro-cap player in the plastic products industrial sector, has seen its investment rating downgraded from Buy to Hold as of 8 June 2026. This adjustment reflects a nuanced assessment across four critical parameters: quality, valuation, financial trend, and technicals. Despite strong financial performance and attractive valuation metrics, evolving technical indicators and market dynamics have tempered the overall outlook.
Read full news article
Dhabriya Polywood Ltd Upgraded to Buy on Strong Fundamentals and Improved Technicals
Dhabriya Polywood Ltd, a micro-cap player in the Plastic Products - Industrial sector, has seen its investment rating upgraded from Hold to Buy as of 1 June 2026. This upgrade reflects significant improvements across four key parameters: quality, valuation, financial trend, and technicals. The company’s robust financial performance, attractive valuation metrics, and stabilising technical indicators have collectively driven this positive reassessment.
Read full news article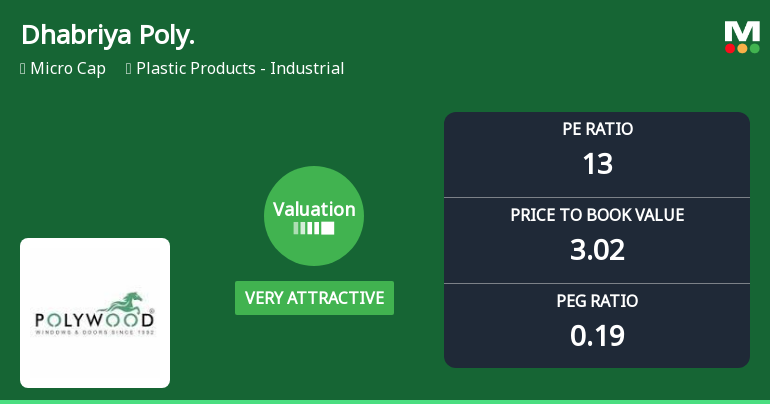
Dhabriya Polywood Ltd Valuation Shifts Signal Renewed Price Attractiveness
Dhabriya Polywood Ltd has witnessed a significant shift in its valuation parameters, moving from an attractive to a very attractive rating, reflecting a notable improvement in price attractiveness relative to its historical and peer benchmarks. Despite a modest decline in share price, the company’s valuation metrics now present a compelling case for investors seeking value in the plastic products industrial sector.
Read full news article Announcements
Announcement under Regulation 30 (LODR)-Analyst / Investor Meet - Intimation
06-Jun-2026 | Source : BSEPursuant to the relevant provisions of the SEBI Listing Regulations we would like to inform you that the officials of our Company Dhabriya Polywood Limited (Company) will be interacting in Samruddhi Season 3 - Nav-Bharat ka Caravan organized by Hem Securities Ltd. on Wednesday 17th June 2026 via video conference.
Announcement under Regulation 30 (LODR)-Earnings Call Transcript
30-May-2026 | Source : BSEEarning Call Transcript of Analyst Meeting is attached.
Compliances-Reg.24(A)-Annual Secretarial Compliance
30-May-2026 | Source : BSEAnnual Secretarial Compliance Report for the year ended March 31 2026.
Corporate Actions

No Upcoming Board Meetings

Dhabriya Polywood Ltd has declared 7% dividend, ex-date: 23 Sep 25

No Splits history available

Dhabriya Polywood Ltd has announced 1:4 bonus issue, ex-date: 21 Oct 15

No Rights history available
Quality key factors
Valuation key factors
Technicals key factors
 Technical Indicator Scale: Bearish, Mildly Bearish, Sideways, Mildly Bullish, Bullish Turned
 Shareholding Snapshot : Mar 2026
Shareholding Compare (%holding)
Promoters
None
Held by 0 Schemes
Held by 1 FIIs (1.51%)
Digvijay Dhabriya (59.98%)
Ashish Kacholia (5.32%)
25.1%
Quarterly Results Snapshot (Consolidated) - Mar'26 - YoY

YoY Growth in quarter ended Mar 2026 is 9.88% vs 15.86% in Mar 2025

YoY Growth in quarter ended Mar 2026 is 54.93% vs 32.27% in Mar 2025
Half Yearly Results Snapshot (Consolidated) - Sep'25
Growth in half year ended Sep 2025 is 10.56% vs 11.36% in Sep 2024
Growth in half year ended Sep 2025 is 60.25% vs 31.99% in Sep 2024
Nine Monthly Results Snapshot (Consolidated) - Dec'25
YoY Growth in nine months ended Dec 2025 is 13.45% vs 9.43% in Dec 2024
YoY Growth in nine months ended Dec 2025 is 72.41% vs 26.25% in Dec 2024
Annual Results Snapshot (Consolidated) - Mar'26
YoY Growth in year ended Mar 2026 is 12.49% vs 11.09% in Mar 2025
YoY Growth in year ended Mar 2026 is 67.17% vs 28.05% in Mar 2025
About Dhabriya Polywood Ltd

Company Coordinates


