
Compare Dhanlaxmi Cotex with Similar Stocks
Dashboard
With a Operating Losses, the company has a Weak Long Term Fundamental Strength
- Poor long term growth as Operating profit has grown by an annual rate of -9.71%
Flat results in Mar 26
With ROE of 0, it has a Expensive valuation with a 0.7 Price to Book Value
Underperformed the market in the last 1 year
Total Returns (Price + Dividend) 
Dhanlaxmi Cotex for the last several years.
Risk Adjusted Returns v/s
Returns Beta

News

Dhanlaxmi Cotex Ltd is Rated Strong Sell
Dhanlaxmi Cotex Ltd is rated Strong Sell by MarketsMOJO. This rating was last updated on 16 Oct 2025, reflecting a significant reassessment of the stock’s outlook. However, all fundamentals, returns, and financial metrics discussed here are current as of 18 June 2026, providing investors with the latest perspective on the company’s position.
Read full news article
Dhanlaxmi Cotex Ltd is Rated Strong Sell
Dhanlaxmi Cotex Ltd is rated Strong Sell by MarketsMOJO. This rating was last updated on 16 Oct 2025. However, the analysis and financial metrics discussed below reflect the stock's current position as of 29 May 2026, providing investors with the latest insights into the company’s performance and outlook.
Read full news article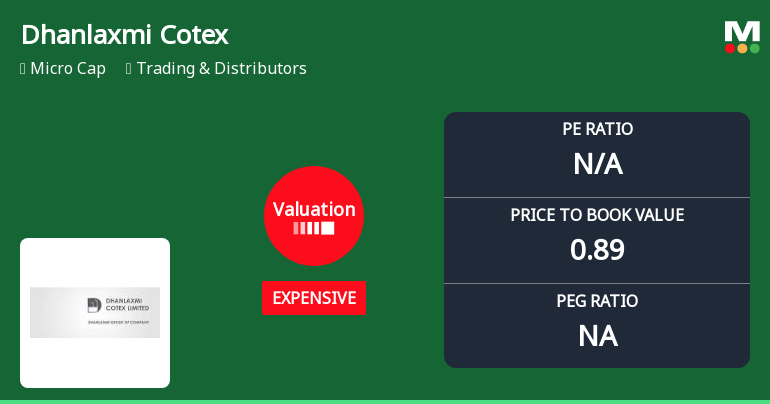
Dhanlaxmi Cotex Ltd Valuation Shifts Signal Price Attractiveness Concerns
Dhanlaxmi Cotex Ltd, a micro-cap player in the Trading & Distributors sector, has witnessed a notable shift in its valuation parameters, moving from a risky to an expensive classification. This transition, coupled with a recent downgrade in its Mojo Grade to Strong Sell, underscores growing concerns about the stock’s price attractiveness relative to its historical and peer benchmarks.
Read full news article Announcements
Compliances-Reg.24(A)-Annual Secretarial Compliance
28-May-2026 | Source : BSEIn terms of Regulation 24(A) of the SEBI (LODR) Regulations 2015 attached is the Annual Secretarial Compliance Report for F.Y. 2025-26.
Announcement under Regulation 30 (LODR)-Newspaper Publication
23-May-2026 | Source : BSESubmission of Newspaper cutting in connection with publication of Financial Results for quarter and year ended 31.03.2026 in terms of Regulation 30 and 47 of SEBI (LODR) Regulations 2015 as amended.
Re-Appointment And Brief Profile Of Internal Auditors In Terms Of Regulation 30 Part - A Of Schedule - III Of The Listing Regulations Read With The SEBI Master Circular No. SEBI/HO/CFD/Pod2/CIR/P/0155 Dated 11Th November 2024
22-May-2026 | Source : BSEIn terms of Regulation 30 of the SEBI (LODR) Regulations this is to inform that the Board of Directors of the Company in its meeting held on 22.05.2026 at 03.00 p.m concluded at 04.20 p.m. held at its registered office have confirmed and approved the re-appointment of M/s. PRSB & Associates (FRN:157616W) as an Internal Auditors of the Company for F.Y. 2026-27. Attached is the brief profile of the Internal Auditors.
Corporate Actions

No Upcoming Board Meetings

No Dividend history available

No Splits history available

No Bonus history available

No Rights history available
Quality key factors
Valuation key factors
Technicals key factors
 Technical Indicator Scale: Bearish, Mildly Bearish, Sideways, Mildly Bullish, Bullish Turned
 Shareholding Snapshot : Mar 2026
Shareholding Compare (%holding)
Promoters
None
Held by 0 Schemes
Held by 0 FIIs
Mahesh Sohanlal Jhawar (68.62%)
Eskay Niryat Pvt Ltd (10.87%)
14.05%
Quarterly Results Snapshot (Standalone) - Mar'26 - QoQ

QoQ Growth in quarter ended Mar 2026 is -47.72% vs 10.55% in Dec 2025
QoQ Growth in quarter ended Mar 2026 is -131.43% vs 159.26% in Dec 2025
Half Yearly Results Snapshot (Standalone) - Sep'25
Growth in half year ended Sep 2025 is -46.96% vs -41.08% in Sep 2024
Growth in half year ended Sep 2025 is -109.40% vs 128.31% in Sep 2024
Nine Monthly Results Snapshot (Standalone) - Dec'25

YoY Growth in nine months ended Dec 2025 is -20.36% vs -40.41% in Dec 2024
YoY Growth in nine months ended Dec 2025 is -97.26% vs 169.45% in Dec 2024
Annual Results Snapshot (Standalone) - Mar'26
YoY Growth in year ended Mar 2026 is -6.54% vs -46.19% in Mar 2025
YoY Growth in year ended Mar 2026 is -98.62% vs 100.35% in Mar 2025
About Dhanlaxmi Cotex Ltd

Company Coordinates


