
Compare Dhanlaxmi Fabric with Similar Stocks
Dashboard
With a Operating Losses, the company has a Weak Long Term Fundamental Strength
- Company's ability to service its debt is weak with a poor EBIT to Interest (avg) ratio of -2.90
- The company has been able to generate a Return on Equity (avg) of 0.44% signifying low profitability per unit of shareholders funds
Risky - Negative EBITDA
Below par performance in long term as well as near term
Stock DNA
Garments & Apparels
INR 41 Cr (Micro Cap)
NA (Loss Making)
23
0.00%
-0.01
-5.06%
0.94
Total Returns (Price + Dividend) 
Latest dividend: 0.3500 per share ex-dividend date: Sep-11-2008
Risk Adjusted Returns v/s
Returns Beta

News
Are Dhanlaxmi Fabrics Ltd latest results good or bad?
Dhanlaxmi Fabrics Ltd's latest financial results for Q4 FY26 present a complex picture. The company reported net sales of ₹6.64 crores, reflecting a year-on-year growth of 66.00%. However, this growth is juxtaposed with significant operational challenges, as the company recorded a net loss of ₹1.77 crores, marking a drastic decline in profitability compared to a profit of ₹0.09 crores in the same quarter last year. This represents a substantial deterioration in financial performance, indicating that the revenue increase has not translated into sustainable profitability. On a sequential basis, the results are equally concerning, with net sales declining by 42.76% from ₹11.60 crores in the previous quarter. The operating margin for Q4 FY26 was reported at -8.58%, which, while a slight improvement from the previous quarter, remains deeply negative. This suggests that the company's core operations are not gene...
Read full news article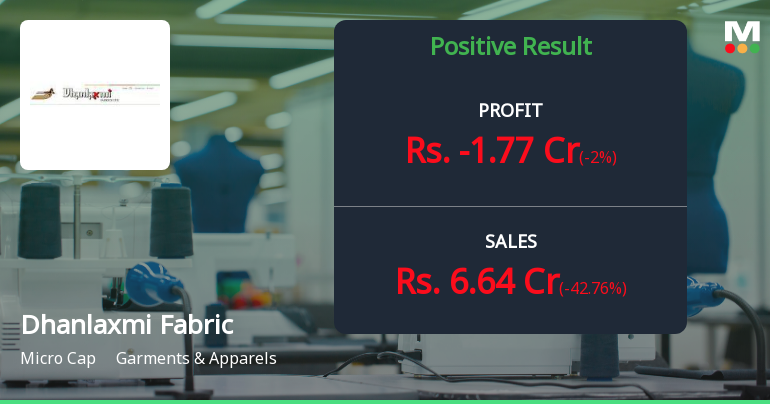
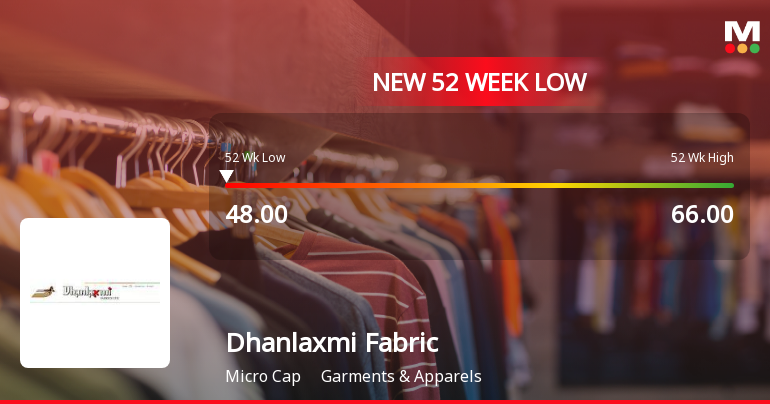
Dhanlaxmi Fabrics Q4 FY26: Mounting Losses Signal Deepening Operational Crisis
Dhanlaxmi Fabrics Ltd., the Thane-based textile processor and garment fabric manufacturer, reported a staggering quarterly loss of ₹1.77 crores for Q4 FY26, marking a dramatic deterioration from the modest ₹0.09 crore profit recorded in Q4 FY25. The company's stock plunged 4.99% following the results announcement, trading at ₹48.41 against a market capitalisation of just ₹44.00 crores, reflecting severe investor concerns about the company's operational viability.
Read full news article Announcements
Board Meeting Outcome for Outcome Of Board Meeting Held On 30.05.2026
30-May-2026 | Source : BSEOutcome of Board meeting held on 30.05.2026
Financial Result For The Financial Year End 31.03.2026
30-May-2026 | Source : BSEEnclosed herewith financial result for the financial year end 31.03.2026
Compliances-Reg.24(A)-Annual Secretarial Compliance
28-May-2026 | Source : BSEPlease find attached annual secretarial compliance report for the year ended 31 March 2026
Corporate Actions

No Upcoming Board Meetings

Dhanlaxmi Fabrics Ltd has declared 5% dividend, ex-date: 11 Sep 08

No Splits history available

No Bonus history available

No Rights history available
Quality key factors
Valuation key factors
Technicals key factors
 Technical Indicator Scale: Bearish, Mildly Bearish, Sideways, Mildly Bullish, Bullish Turned
 Shareholding Snapshot : Mar 2026
Shareholding Compare (%holding)
Promoters
None
Held by 0 Schemes
Held by 0 FIIs
Vinod Sohanlal Jhawar (17.84%)
Eskay Niryat Pvt Ltd (14.92%)
7.62%
Quarterly Results Snapshot (Consolidated) - Mar'26 - QoQ

QoQ Growth in quarter ended Mar 2026 is -42.76% vs 202.08% in Dec 2025
QoQ Growth in quarter ended Mar 2026 is -2,428.57% vs 94.66% in Dec 2025
Half Yearly Results Snapshot (Consolidated) - Sep'25

Growth in half year ended Sep 2025 is -8.62% vs -27.63% in Sep 2024
Growth in half year ended Sep 2025 is -4,800.00% vs 99.10% in Sep 2024
Nine Monthly Results Snapshot (Consolidated) - Dec'25
YoY Growth in nine months ended Dec 2025 is 94.84% vs -34.18% in Dec 2024
YoY Growth in nine months ended Dec 2025 is 0.00% vs 100.00% in Dec 2024
Annual Results Snapshot (Consolidated) - Mar'26
YoY Growth in year ended Mar 2026 is 86.04% vs -34.22% in Mar 2025
YoY Growth in year ended Mar 2026 is -3,766.67% vs 101.17% in Mar 2025
About Dhanlaxmi Fabrics Ltd

Company Coordinates


