
Compare Dhansafal Fin with Similar Stocks
Dashboard
Weak Long Term Fundamental Strength with an average Return on Equity (ROE) of 2.87%
- Company's ability to service its debt is weak with a poor EBIT to Interest (avg) ratio of 0.99
With ROCE of 3.4, it has a Very Expensive valuation with a 0.9 Enterprise value to Capital Employed
Below par performance in long term as well as near term
Total Returns (Price + Dividend) 
Latest dividend: 0.02 per share ex-dividend date: Sep-09-2024
Risk Adjusted Returns v/s
Returns Beta

News

Dhansafal Finserve Ltd is Rated Strong Sell
Dhansafal Finserve Ltd is rated Strong Sell by MarketsMOJO. This rating was last updated on 29 July 2025, reflecting a reassessment of the stock’s outlook. However, the analysis and financial metrics presented here are based on the company’s current position as of 17 June 2026, providing investors with the most up-to-date view of its performance and prospects.
Read full news article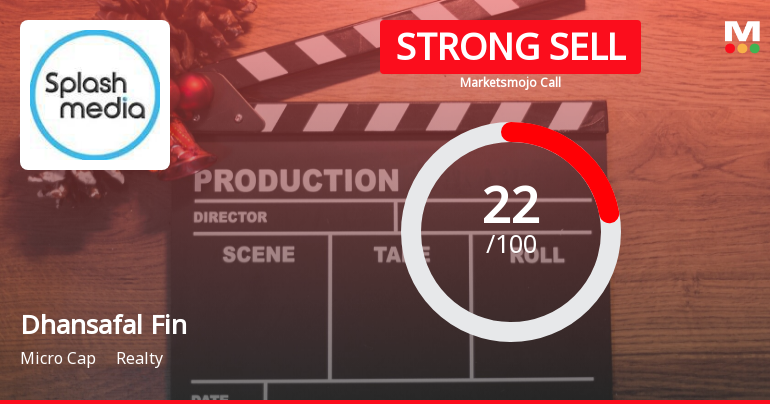
Dhansafal Finserve Ltd is Rated Strong Sell
Dhansafal Finserve Ltd is rated 'Strong Sell' by MarketsMOJO, with this rating last updated on 29 July 2025. However, the analysis and financial metrics presented here reflect the stock's current position as of 29 May 2026, providing investors with an up-to-date view of the company’s fundamentals, valuation, financial trends, and technical outlook.
Read full news articleAre Dhansafal Finserve Ltd latest results good or bad?
Dhansafal Finserve Ltd's latest financial results for Q4 FY26 indicate a significant operational performance with net sales reaching ₹3.64 crores, which represents a year-on-year growth of 97.83%. This marks a notable sequential increase of 3.41% from the previous quarter. The company also reported a net profit of ₹0.50 crores, reflecting a year-on-year increase of 163.16%, and a substantial improvement in operating margin to 44.78%, up 12.17 percentage points from the same quarter last year. Despite these positive operational metrics, the company faces challenges regarding its overall financial health. The average return on equity (ROE) remains low at 2.63%, indicating inefficiencies in generating returns for shareholders. Similarly, the return on capital employed (ROCE) is also weak at 3.92%, raising concerns about the sustainability of the recent revenue growth. The balance sheet shows a significant in...
Read full news article Announcements
Announcement under Regulation 30 (LODR)-Newspaper Publication
28-May-2026 | Source : BSENewspaper Advertisement for the Financial Results for the quarter and financial year ended March 31 2026.
Compliances-Reg.24(A)-Annual Secretarial Compliance
28-May-2026 | Source : BSEPursuant to Regulation 24A of SEBI Listing Regulations we hereby enclose Annual Secretarial Compliance Report for the financial year ended March 31 2026.
Audited Financial Results For The Quarter And Financial Year Ended March 31 2026.
27-May-2026 | Source : BSEAudited Financial Results for the quarter and financial year ended March 31 2026.
Corporate Actions

No Upcoming Board Meetings

Dhansafal Finserve Ltd has declared 2% dividend, ex-date: 09 Sep 24

Dhansafal Finserve Ltd has announced 1:10 stock split, ex-date: 29 Jul 10

Dhansafal Finserve Ltd has announced 3:1 bonus issue, ex-date: 23 Dec 09

Dhansafal Finserve Ltd has announced 1:1 rights issue, ex-date: 02 Aug 24
Quality key factors
Valuation key factors
Technicals key factors
 Technical Indicator Scale: Bearish, Mildly Bearish, Sideways, Mildly Bullish, Bullish Turned
 Shareholding Snapshot : Mar 2026
Shareholding Compare (%holding)
Promoters
None
Held by 0 Schemes
Held by 0 FIIs
Anil Agrawal Huf (24.84%)
Rupesh Chandrakant Vaghasia (1.1%)
35.95%
Quarterly Results Snapshot (Standalone) - Mar'26 - YoY

YoY Growth in quarter ended Mar 2026 is 97.83% vs 308.89% in Mar 2025

YoY Growth in quarter ended Mar 2026 is 163.16% vs 111.11% in Mar 2025
Half Yearly Results Snapshot (Standalone) - Sep'25
Growth in half year ended Sep 2025 is 177.05% vs 125.93% in Sep 2024
Growth in half year ended Sep 2025 is -83.87% vs -18.42% in Sep 2024
Nine Monthly Results Snapshot (Standalone) - Dec'25
YoY Growth in nine months ended Dec 2025 is 185.38% vs 155.08% in Dec 2024
YoY Growth in nine months ended Dec 2025 is 27.78% vs -65.38% in Dec 2024
Annual Results Snapshot (Standalone) - Mar'26
YoY Growth in year ended Mar 2026 is 151.65% vs 198.16% in Mar 2025
YoY Growth in year ended Mar 2026 is 97.30% vs -39.34% in Mar 2025
About Dhansafal Finserve Ltd

Company Coordinates


