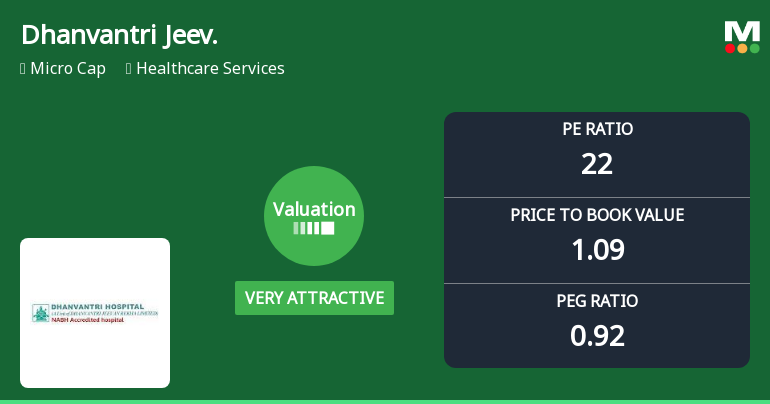
Dhanvantri Jeev.

  • Market Cap: Micro Cap
  • Industry: Healthcare Services
  • ISIN: INE239F01015
  • NSEID:
  • BSEID: 531043
INR
27.40
-0.05 (-0.18%)
BSENSE

Jul 10, 03:30 PM

BSE+NSE Vol: 4.34 k

  • Price Points
  • Score
  • Mojo Parameters
  • Total Return
  • News and Corporate Actions
  • Key factors
  • Shareholding
  • Financials
  • CompanyCV
stock-summaryPrice Point
High/Low

1Day

52 Week

Valuation
Technical
Day's Volume

CASH

4.34 k (32.67%) Volume

Shareholding (Mar 2026)

FII

0.00%

Held by 0 FIIs

DII

0.00%

Held by 0 DIIs

Promoter

19.65%

Why is Dhanvantri Jeevan Rekha Ltd falling/rising?

10-Jul-2026

As of 09-Jul, Dhanvantri Jeevan Rekha Ltd's stock price is rising to Rs 27.45 after a trend reversal, despite an initial loss. The stock shows strong relative performance, trading above key moving averages, with increased investor participation indicating growing confidence.

As of 09-Jul, Dhanvantri Jeevan Rekha Ltd's stock price is rising, currently at Rs 27.45, reflecting an increase of Rs 1.2 or 4.57%. This upward movement follows a trend reversal after two consecutive days of decline. Although the stock opened with a loss of 4.69% today, it managed to reach an intraday high of Rs 27.45, indicating a recovery during the trading session.<BR><BR>The stock has outperformed the sector by 3.4%, which suggests strong relative performance compared to its peers. Additionally, Dhanvantri Jeevan Rekha Ltd is trading above its 5-day, 20-day, 50-day, 100-day, and 200-day moving averages, indicating a positive trend in the stock's performance over various time frames. <BR><BR>Investor participation has also increased, with a delivery volume of 3.47k on 08 Jul, which is up by 4.3% compared to the 5-day average delivery volume. This suggests growing interest and confidence among investors in the stock. Overall, these factors contribute to the stock's rise despite the initial opening loss.

View full answer

Should I buy, sell or hold Dhanvantri Jeevan Rekha Ltd?

07-Jul-2026

How big is Dhanvantri Jeev.?

11-Jun-2026

As of 10th June, Dhanvantri Jeevan Rekha Ltd has a market capitalization of 8.00 Cr, with Net Sales of 25.86 Cr and a Net Profit of 0.39 Cr reported in the latest four quarters. Shareholder's Funds are 10.13 Cr and Total Assets are 14.75 Cr as of March 2025.

As of 10th June, Dhanvantri Jeevan Rekha Ltd has a market capitalization of 8.00 Cr, categorizing it as a Micro Cap company.<BR><BR>In the latest four quarters, the company reported Net Sales of 25.86 Cr and a Net Profit of 0.39 Cr.<BR><BR>For the latest annual period ending in March 2025, Shareholder's Funds amounted to 10.13 Cr, while Total Assets were reported at 14.75 Cr.

View full answer

Who are in the management team of Dhanvantri Jeev.?

11-Jun-2026

The management team of Dhanvantri Jeev includes V S Phull and Shalini Sharma as Managing Directors, along with several other directors and officers, such as Premjit S Kashyap (Chairman), Ashokkumar Singh Chaudhary, and Ritika Bhandari (Company Secretary). This team is responsible for overseeing the company's operations and governance.

The management team of Dhanvantri Jeev includes the following individuals:<BR><BR>1. **V S Phull** - Managing Director<BR>2. **Shalini Sharma** - Managing Director<BR>3. **Meenaakashi Elhence** - Non-Executive & Non-Independent Director<BR>4. **Premjit S Kashyap** - Chairman (Non-Executive)<BR>5. **Ashokkumar Singh Chaudhary** - Non-Executive & Independent Director<BR>6. **Ajay Rajpal** - Non-Executive & Independent Director<BR>7. **Ritika Bhandari** - Company Secretary & Compliance Officer<BR>8. **Anil Elhence** - Director<BR>9. **Rowena Sharma** - Director<BR>10. **Tulsi Prasad** - Director<BR>11. **Mohd Haaris** - Director<BR>12. **Amitabh Krishna Bhatia** - Additional Director<BR><BR>This team oversees the operations and governance of the company.

View full answer

Who are the peers of the Dhanvantri Jeev.?

11-Jun-2026

The peers of Dhanvantri Jeev. include Transgene Biotek, Adeshwar Meditex, Family Care, Vanta Bioscience, Looks Health, Clinitech Lab, Dr Lalchand. Lab, Ashram Online, and Gian Lifecare. Dhanvantri Jeev. has an average management risk and a 1-year return of -7.25%, better than Gian Lifecare's -62.42% but worse than Looks Health's 96.39%.

Peers: The peers of Dhanvantri Jeev. are Transgene Biotek, Adeshwar Meditex, Family Care, Vanta Bioscience, Looks Health, Clinitech Lab, Dr Lalchand. Lab, Ashram Online, and Gian Lifecare.<BR><BR>Quality Snapshot: Excellent management risk is observed at Family Care, while Average management risk is found at Adeshwar Meditex and Dhanvantri Jeev., and Below Average management risk is noted at Transgene Biotek, Vanta Bioscience, Clinitech Lab, Dr Lalchand. Lab, and Gian Lifecare, along with the rest. Good growth is seen at Family Care, while Below Average growth is noted at Adeshwar Meditex, Transgene Biotek, Vanta Bioscience, Clinitech Lab, Dr Lalchand. Lab, Dhanvantri Jeev., and Gian Lifecare, and the rest do not qualify. Good capital structure is observed at Family Care, Clinitech Lab, Dr Lalchand. Lab, and Gian Lifecare, while Average capital structure is found at Adeshwar Meditex, and the rest do not qualify.<BR><BR>Return Snapshot: The peer with the highest 1-year return is Looks Health at 96.39%, while Gian Lifecare has the lowest at -62.42%. Dhanvantri Jeev.'s 1-year return of -7.25% is better than Gian Lifecare's but worse than Looks Health's. Additionally, the six-month return is negative for Transgene Biotek, Adeshwar Meditex, Family Care, Vanta Bioscience, Clinitech Lab, Dr Lalchand. Lab, Ashram Online, and Gian Lifecare.

View full answer

What does Dhanvantri Jeev. do?

10-Jun-2026

Dhanvantri Jeevan Rekha Ltd is a micro-cap multi-speciality hospital offering diagnostic and therapeutic services, with recent net sales of 7 Cr and a market cap of 8 Cr. The company has been operational since 1993 and reported a net profit of 0 Cr for the quarter ending March 2026.

Overview:<BR>Dhanvantri Jeevan Rekha Ltd is a multi-speciality hospital providing reliable diagnostic and therapeutical services in the healthcare services industry, categorized as a micro-cap company.<BR><BR>History:<BR>Incorporated on June 11, 1993, Dhanvantri Jeevan Rekha Ltd has been operational for approximately 30 years. The latest quarterly results reported net sales and net profit for the period ending March 2026.<BR><BR>Financial Snapshot:<BR>Most recent Net Sales: 7 Cr (Quarterly Results - Mar 2026) <BR>Most recent Net Profit: 0 Cr (Quarterly Results - Mar 2026) <BR>Market-cap value: INR 8 Cr (Micro Cap)<BR><BR>Key Metrics:<BR>P/E: 21.00 <BR>Industry P/E: 81 <BR>Dividend Yield: 0.00% <BR>Debt Equity: -0.34 <BR>Return on Equity: 3.71% <BR>Price to Book: 0.78 <BR><BR>Contact Details:<BR>Address: 1 Saket, Meerut, Uttar Pradesh: 250003 <BR>Phone: 91-0121-2648151/2648152 <BR>Email: dhanvantrihospital@gmail.com <BR>Website: http://www.djrl.org.in

View full answer

When is the next results date for Dhanvantri Jeevan Rekha Ltd?

20-May-2026

The next results date for Dhanvantri Jeevan Rekha Ltd is 28 May 2026.

The next results date for Dhanvantri Jeevan Rekha Ltd is scheduled for 28 May 2026.

View full answer

Are Dhanvantri Jeevan Rekha Ltd latest results good or bad?

13-Feb-2026

Dhanvantri Jeevan Rekha Ltd's latest Q3 FY26 results show strong revenue growth and a significant increase in net profit, but ongoing challenges with low return on equity and a high P/E ratio suggest caution for investors. Overall, the results present a mixed outlook.

Dhanvantri Jeevan Rekha Ltd's latest results for Q3 FY26 show a mix of positive developments and ongoing challenges. On the positive side, the company reported a net profit of ₹0.17 crore, which represents a remarkable 221.43% increase quarter-on-quarter and a 13.33% increase year-on-year. Additionally, net sales reached ₹7.27 crores, marking a strong 27.54% year-on-year growth and the highest quarterly figure in two years.<BR><BR>The operating margin improved to 3.99%, the highest in eight quarters, indicating a recovery in operational performance. However, despite these positive indicators, the company faces significant structural challenges. The average return on equity (ROE) remains low at 2.25%, which is below industry standards, and the return on capital employed (ROCE) is negative at -4.36%, suggesting issues with capital efficiency.<BR><BR>Moreover, the company's high P/E ratio of 104x raises concerns about its valuation, especially when compared to the healthcare services industry average of 59x. This valuation appears stretched given the company's underlying profitability and growth trajectory.<BR><BR>In summary, while the recent quarterly results indicate a recovery and growth in revenue, the company's persistent capital efficiency issues and high valuation present a mixed picture. Investors should weigh these factors carefully when assessing the company's performance.

View full answer

Is Dhanvantri Jeev. overvalued or undervalued?

18-Nov-2025

As of November 17, 2025, Dhanvantri Jeev is considered risky and overvalued with a PE ratio of 103.48, low ROE of 1.00%, negative ROCE of -2.81%, and a PEG ratio of 0.00, despite a 23.17% stock return over the past year, suggesting caution for investors.

As of 17 November 2025, Dhanvantri Jeev's valuation grade has moved from very attractive to risky, indicating a significant shift in its perceived investment quality. The company is currently overvalued, with a price-to-earnings (PE) ratio of 103.48, which is substantially higher than peers like Apollo Hospitals at 64.41 and Max Healthcare at 77.22. Additionally, the EV to EBITDA ratio stands at 9.21, which, while not excessively high, still reflects a premium compared to the industry average.<BR><BR>In terms of performance metrics, Dhanvantri Jeev has a return on equity (ROE) of 1.00% and a return on capital employed (ROCE) of -2.81%, both of which are concerning and suggest inefficiencies in generating returns relative to its equity and capital. The company's PEG ratio is 0.00, indicating no growth expectations factored into its valuation, further supporting the conclusion that it is overvalued. Despite recent stock performance showing a 23.17% return over the past year compared to the Sensex's 9.50%, the underlying financial ratios and peer comparisons suggest that investors should approach Dhanvantri Jeev with caution.

View full answer

How has been the historical performance of Dhanvantri Jeev.?

14-Nov-2025

Dhanvantri Jeev has shown positive growth in net sales, increasing from 16.77 Cr in Mar'22 to 22.65 Cr in Mar'25, while profitability has fluctuated, with profit after tax improving from a loss of -1.42 Cr in Mar'21 to a profit of 0.51 Cr in Mar'25. Despite growth in sales, the company’s financial metrics indicate the need for ongoing monitoring and strategic management.

Answer:<BR>The historical performance of Dhanvantri Jeev shows a fluctuating trend in net sales and profitability over the years.<BR><BR>Breakdown:<BR>Dhanvantri Jeev's net sales have increased from 16.77 Cr in Mar'22 to 22.65 Cr in Mar'25, indicating a positive growth trajectory. The total operating income followed a similar pattern, rising from 16.77 Cr in Mar'22 to 22.65 Cr in Mar'25. However, the operating profit (PBDIT) has shown volatility, peaking at 1.71 Cr in Mar'22 before declining to 1.12 Cr in Mar'25. Profit before tax also fluctuated, with a notable loss of -1.63 Cr in Mar'21, but rebounded to 0.56 Cr in Mar'25. Profit after tax improved from a loss of -1.42 Cr in Mar'21 to a profit of 0.51 Cr in Mar'25. The company's total assets decreased slightly from 15.02 Cr in Mar'24 to 14.75 Cr in Mar'25, while total liabilities also saw a decline from 15.02 Cr to 14.75 Cr in the same period. Cash flow from operating activities has been positive, with a net cash inflow of 2.00 Cr in Mar'24, reflecting improved liquidity. Overall, while Dhanvantri Jeev has experienced growth in sales and a recovery in profitability, its financial metrics indicate a need for continued monitoring and strategic management.

View full answer

What is the technical trend for Dhanvantri Jeev.?

09-Jun-2025

As of May 30, 2025, Dhanvantri Jeev's trend has shifted to a moderate bearish stance, supported by bearish momentum in the MACD, moving averages, and KST indicators, along with mildly bearish Bollinger Bands on both weekly and monthly time frames.

As of 30 May 2025, the technical trend for Dhanvantri Jeev has changed from mildly bearish to bearish. The current stance is bearish with a moderate strength. Key indicators driving this include the weekly MACD showing bearish momentum, daily moving averages confirming a bearish trend, and the KST on a weekly basis also indicating bearish conditions. The Bollinger Bands are mildly bearish on both weekly and monthly time frames, reinforcing the overall bearish outlook. The Dow Theory suggests a mildly bearish trend on the weekly chart, while the monthly chart shows no clear trend.

View full answer

Who are the top shareholders of the Dhanvantri Jeev.?

06-Jun-2025

The top shareholders of Dhanvantri Jeev include promoter Anil Elhence with 6.76% and public shareholder Rowena Sharma with 9.43%. Individual investors collectively hold 42.34%, with no mutual funds or foreign institutional investors involved, and no pledged promoter holdings.

The top shareholders of Dhanvantri Jeev include Anil Elhence, who is the promoter with the highest holding at 6.76%. The highest public shareholder is Rowena Sharma, holding 9.43%. Additionally, individual investors collectively hold 42.34% of the company's shares. There are no mutual funds or foreign institutional investors currently holding shares in the company, and there are no pledged promoter holdings.

View full answer

Has Dhanvantri Jeev. declared dividend?

06-Jun-2025

Dhanvantri Jeevan Rekha Ltd has declared a 4% dividend, amounting to 0.4100 per share, with an ex-date of September 15, 2011. However, the dividend yield is 0%, and total returns over various periods show significant price growth despite the lack of dividend income.

Dhanvantri Jeevan Rekha Ltd has declared a 4% dividend.<BR><BR>Dividend Details:<BR>- Percentage announced: 4%<BR>- Amount per share: 0.4100<BR>- Ex-date: Sep-15-2011<BR><BR>Dividend Yield: 0%<BR><BR>Total Returns by Period:<BR>In the 6-month period, the price return was -27.48%, the dividend return was 0%, resulting in a total return of -27.48%.<BR><BR>In the 1-year period, the price return was 5.94%, the dividend return was 0%, resulting in a total return of 5.94%.<BR><BR>In the 2-year period, the price return was 39.92%, the dividend return was 0%, resulting in a total return of 39.92%.<BR><BR>In the 3-year period, the price return was 39.92%, the dividend return was 0%, resulting in a total return of 39.92%.<BR><BR>In the 4-year period, the price return was 204.44%, the dividend return was 0%, resulting in a total return of 204.44%.<BR><BR>In the 5-year period, the price return was 212.43%, the dividend return was 0%, resulting in a total return of 212.43%.<BR><BR>Overall, while Dhanvantri Jeevan Rekha Ltd has declared a dividend, the dividend yield remains at 0%. The total returns over various periods show a significant increase in price returns, particularly over the longer term, indicating potential growth despite the lack of dividend yield.

View full answer
iScoreScore
Click here to find our call on this stock
Strong Sell
Sell
Hold
Buy
Strong Buy

Dashboard

1

Weak Long Term Fundamental Strength with an average Return on Equity (ROE) of 3.14%

  • Poor long term growth as Operating profit has grown by an annual rate 15.25% of over the last 5 years
  • Company's ability to service its debt is weak with a poor EBIT to Interest (avg) ratio of 0.03
stock-summaryMojo Parameters

Mojo Parameters

Loading Valuation Snapshot...

Stock DNA

stock-summary
Industry

Healthcare Services

stock-summary
Market cap

INR 11 Cr (Micro Cap)

stock-summary
P/E

29.00

stock-summary
Industry P/E

63

stock-summary
Dividend Yield

0.00%

stock-summary
Debt Equity

-0.34

stock-summary
Return on Equity

3.71%

stock-summary
Price to Book

1.07

Revenue and Profits:
Net Sales:
7 Cr
(Quarterly Results - Mar 2026)
Net Profit:
0 Cr
stock-summaryTotal Returns
Total Returns (Price + Dividend) stock-summary
Dividend Yield (0%)
TimePeriod
Price Return
Dividend Return
Total Return
3 Months
-5.19%
0%
-5.19%
6 Months
11.65%
0%
11.65%
1 Year
40.37%
0%
40.37%
2 Years
30.17%
0%
30.17%
3 Years
140.35%
0%
140.35%
4 Years
160.21%
0%
160.21%
5 Years
197.83%
0%
197.83%

Latest dividend: 0.4100 per share ex-dividend date: Sep-15-2011

Risk Adjusted Returns v/s stock-summary
Returns Beta
Icon
Beta has not been calculated since enough price history is not available
stock-summaryNews & Corporate Actions

News

Dhanvantri Jeevan Rekha Ltd’s Mixed Week: -0.53% Price, +1.31% Sensex Tell the Story

Announcements stock-summary

Clarification In Regards To Price Movement

02-Jul-2026 | Source : BSE

The company is submitting the same in respect of the clarification in regards to Price Movement

Clarification sought from Dhanvantri Jeevan Rekha Ltd

30-Jun-2026 | Source : BSE

The Exchange has sought clarification from Dhanvantri Jeevan Rekha Ltd on June 30 2026 with reference to significant movement in price in order to ensure that investors have latest relevant information about the company and to inform the market so that the interest of the investors is safeguarded.

The reply is awaited.

Closure of Trading Window

29-Jun-2026 | Source : BSE

The trading window closure done for the quarter June 2026

Corporate Actions stock-summary

stock-summary
BOARD MEETING

No Upcoming Board Meetings

stock-summary
DIVIDEND

Dhanvantri Jeevan Rekha Ltd has declared 4% dividend, ex-date: 15 Sep 11

stock-summary
SPLITS

No Splits history available

stock-summary
BONUS

No Bonus history available

stock-summary
RIGHTS

No Rights history available

stock-summaryKey Factors

Quality key factors stock-summary

Factor
Value
Sales Growth (5y)
21.47%
EBIT Growth (5y)
15.25%
EBIT to Interest (avg)
0.03
Debt to EBITDA (avg)
Negative Net Debt
Net Debt to Equity (avg)
-0.34
Sales to Capital Employed (avg)
1.97
Tax Ratio
0
Dividend Payout Ratio
0
Pledged Shares
0
Institutional Holding
0
ROCE (avg)
-2.24%
ROE (avg)
3.14%

Valuation key factors

Factor
Value
P/E Ratio
29
Industry P/E
63
Price to Book Value
1.07
EV to EBIT
7.70
EV to EBITDA
7.70
EV to Capital Employed
1.10
EV to Sales
0.30
PEG Ratio
NA
Dividend Yield
NA
ROCE (Latest)
0.86%
ROE (Latest)
3.71%

Technicals key factors

Indicator
Weekly
Monthly
MACD
Mildly Bullish
Mildly Bearish
RSI
No Signal
Bearish
Bollinger Bands
Bullish
Mildly Bullish
Moving Averages
Mildly Bearish (Daily)
KST
Bearish
Bullish
Dow Theory
Mildly Bullish
Mildly Bullish
stock-summary Technical Indicator Scale: Bearish, Mildly Bearish, Sideways, Mildly Bullish, Bullish  Turned 
stock-summaryShareholding
Shareholding Snapshot : Mar 2026stock-summary
Shareholding Compare (%holding) stock-summary
Majority shareholders

Non Institution

Pledged Promoter Holdings

None

Mutual Funds

Held by 0 Schemes

FIIs

Held by 0 FIIs

Promoter with highest holding

Anil Elhence (6.76%)

Highest Public shareholder

Rowena Sharma (9.43%)

Individual Investors Holdings

50.67%

stock-summaryFinancial
[
  {
    "link": "quarterly",
    "btn_text": "All Quarterly Results",
    "header": "Quarterly Results Snapshot (Standalone) - Mar'26 - YoY",
    "rhs": [
      {
        "prefix": "Net Sales ",
        "suffix": "YoY Growth in quarter ended Mar 2026 is 24.19% vs 7.17% in Mar 2025",
        "dir": 1
      },
      {
        "prefix": "Standalone Net Profit ",
        "suffix": "YoY Growth in quarter ended Mar 2026 is 900.00% vs 133.33% in Mar 2025",
        "dir": 1
      }
    ],
    "table": {
      "header": [
        "Mar'26",
        "Mar'25",
        "Change(%)"
      ],
      "body": [
        {
          "field": "Net Sales",
          "val1": "7.24",
          "val2": "5.83",
          "chgp": "24.19%",
          "chgp_class": "positive"
        },
        {
          "field": "Operating Profit (PBDIT) excl Other Income",
          "val1": "0.39",
          "val2": "0.04",
          "chgp": "875.00%",
          "chgp_class": "positive"
        },
        {
          "field": "Interest",
          "val1": "0.00",
          "val2": "0.00",
          "chgp": "",
          "chgp_class": "neutral"
        },
        {
          "field": "Exceptional Items",
          "val1": "0.00",
          "val2": "0.00",
          "chgp": "",
          "chgp_class": "neutral"
        },
        {
          "field": "Standalone Net Profit",
          "val1": "0.30",
          "val2": "0.03",
          "chgp": "900.00%",
          "chgp_class": "positive"
        },
        {
          "field": "Operating Profit Margin (Excl OI)",
          "val1": "5.39%",
          "val2": "0.69%",
          "chgp": "4.70%",
          "chgp_class": "positive"
        }
      ]
    }
  },
  {
    "link": "half-yearly",
    "btn_text": "All Half Yearly Results",
    "header": "Half Yearly Results Snapshot (Standalone) - Sep'25",
    "rhs": [
      {
        "prefix": "Net Sales ",
        "suffix": " Growth in half year ended Sep 2025 is 2.07% vs 12.55% in Sep 2024",
        "dir": -1
      },
      {
        "prefix": "Standalone Net Profit ",
        "suffix": " Growth in half year ended Sep 2025 is -124.24% vs 430.00% in Sep 2024",
        "dir": -1
      }
    ],
    "table": {
      "header": [
        "Sep'25",
        "Sep'24",
        "Change(%)"
      ],
      "body": [
        {
          "field": "Net Sales",
          "val1": "11.35",
          "val2": "11.12",
          "chgp": "2.07%",
          "chgp_class": "positive"
        },
        {
          "field": "Operating Profit (PBDIT) excl Other Income",
          "val1": "0.07",
          "val2": "0.49",
          "chgp": "-85.71%",
          "chgp_class": "negative"
        },
        {
          "field": "Interest",
          "val1": "0.00",
          "val2": "0.01",
          "chgp": "-100.00%",
          "chgp_class": "positive"
        },
        {
          "field": "Exceptional Items",
          "val1": "0.00",
          "val2": "0.00",
          "chgp": "",
          "chgp_class": "neutral"
        },
        {
          "field": "Standalone Net Profit",
          "val1": "-0.08",
          "val2": "0.33",
          "chgp": "-124.24%",
          "chgp_class": "negative"
        },
        {
          "field": "Operating Profit Margin (Excl OI)",
          "val1": "0.62%",
          "val2": "4.41%",
          "chgp": "-3.79%",
          "chgp_class": "negative"
        }
      ]
    }
  },
  {
    "link": "nine-monthly",
    "btn_text": "All Nine Monthly Results",
    "header": "Nine Monthly Results Snapshot (Standalone) - Dec'25",
    "rhs": [
      {
        "prefix": "Net Sales ",
        "suffix": "YoY Growth in nine months ended Dec 2025 is 10.70% vs 11.91% in Dec 2024",
        "dir": -1
      },
      {
        "prefix": "Standalone Net Profit ",
        "suffix": "YoY Growth in nine months ended Dec 2025 is -81.25% vs 84.62% in Dec 2024",
        "dir": -1
      }
    ],
    "table": {
      "header": [
        "Dec'25",
        "Dec'24",
        "Change(%)"
      ],
      "body": [
        {
          "field": "Net Sales",
          "val1": "18.62",
          "val2": "16.82",
          "chgp": "10.70%",
          "chgp_class": "positive"
        },
        {
          "field": "Operating Profit (PBDIT) excl Other Income",
          "val1": "0.36",
          "val2": "0.68",
          "chgp": "-47.06%",
          "chgp_class": "negative"
        },
        {
          "field": "Interest",
          "val1": "0.00",
          "val2": "0.01",
          "chgp": "-100.00%",
          "chgp_class": "positive"
        },
        {
          "field": "Exceptional Items",
          "val1": "0.00",
          "val2": "0.00",
          "chgp": "",
          "chgp_class": "neutral"
        },
        {
          "field": "Standalone Net Profit",
          "val1": "0.09",
          "val2": "0.48",
          "chgp": "-81.25%",
          "chgp_class": "negative"
        },
        {
          "field": "Operating Profit Margin (Excl OI)",
          "val1": "1.93%",
          "val2": "4.04%",
          "chgp": "-2.11%",
          "chgp_class": "negative"
        }
      ]
    }
  },
  {
    "link": "annual",
    "btn_text": "All Annual Results",
    "header": "Annual Results Snapshot (Standalone) - Mar'26",
    "rhs": [
      {
        "prefix": "Net Sales ",
        "suffix": "YoY Growth in year ended Mar 2026 is 14.17% vs 10.65% in Mar 2025",
        "dir": 1
      },
      {
        "prefix": "Standalone Net Profit ",
        "suffix": "YoY Growth in year ended Mar 2026 is -21.57% vs 200.00% in Mar 2025",
        "dir": -1
      }
    ],
    "table": {
      "header": [
        "Mar'26",
        "Mar'25",
        "Change(%)"
      ],
      "body": [
        {
          "field": "Net Sales",
          "val1": "25.86",
          "val2": "22.65",
          "chgp": "14.17%",
          "chgp_class": "positive"
        },
        {
          "field": "Operating Profit (PBDIT) excl Other Income",
          "val1": "0.76",
          "val2": "0.71",
          "chgp": "7.04%",
          "chgp_class": "positive"
        },
        {
          "field": "Interest",
          "val1": "0.00",
          "val2": "0.00",
          "chgp": "",
          "chgp_class": "neutral"
        },
        {
          "field": "Exceptional Items",
          "val1": "0.00",
          "val2": "0.00",
          "chgp": "",
          "chgp_class": "neutral"
        },
        {
          "field": "Standalone Net Profit",
          "val1": "0.40",
          "val2": "0.51",
          "chgp": "-21.57%",
          "chgp_class": "negative"
        },
        {
          "field": "Operating Profit Margin (Excl OI)",
          "val1": "2.94%",
          "val2": "3.13%",
          "chgp": "-0.19%",
          "chgp_class": "negative"
        }
      ]
    }
  }
]

Quarterly Results Snapshot (Standalone) - Mar'26 - YoYstock-summary

Mar'26
Mar'25
Change(%)
Net Sales
7.24
5.83
24.19%
Operating Profit (PBDIT) excl Other Income
0.39
0.04
875.00%
Interest
0.00
0.00
Exceptional Items
0.00
0.00
Standalone Net Profit
0.30
0.03
900.00%
Operating Profit Margin (Excl OI)
5.39%
0.69%
4.70%
Values in Rs Cr.
Direction Arrows
Net Sales

YoY Growth in quarter ended Mar 2026 is 24.19% vs 7.17% in Mar 2025

Direction Arrows
Standalone Net Profit

YoY Growth in quarter ended Mar 2026 is 900.00% vs 133.33% in Mar 2025

Half Yearly Results Snapshot (Standalone) - Sep'25stock-summary

Sep'25
Sep'24
Change(%)
Net Sales
11.35
11.12
2.07%
Operating Profit (PBDIT) excl Other Income
0.07
0.49
-85.71%
Interest
0.00
0.01
-100.00%
Exceptional Items
0.00
0.00
Standalone Net Profit
-0.08
0.33
-124.24%
Operating Profit Margin (Excl OI)
0.62%
4.41%
-3.79%
Values in Rs Cr.
Direction Arrows
Net Sales

Growth in half year ended Sep 2025 is 2.07% vs 12.55% in Sep 2024

Direction Arrows
Standalone Net Profit

Growth in half year ended Sep 2025 is -124.24% vs 430.00% in Sep 2024

Nine Monthly Results Snapshot (Standalone) - Dec'25stock-summary

Dec'25
Dec'24
Change(%)
Net Sales
18.62
16.82
10.70%
Operating Profit (PBDIT) excl Other Income
0.36
0.68
-47.06%
Interest
0.00
0.01
-100.00%
Exceptional Items
0.00
0.00
Standalone Net Profit
0.09
0.48
-81.25%
Operating Profit Margin (Excl OI)
1.93%
4.04%
-2.11%
Values in Rs Cr.
Direction Arrows
Net Sales

YoY Growth in nine months ended Dec 2025 is 10.70% vs 11.91% in Dec 2024

Direction Arrows
Standalone Net Profit

YoY Growth in nine months ended Dec 2025 is -81.25% vs 84.62% in Dec 2024

Annual Results Snapshot (Standalone) - Mar'26stock-summary

Mar'26
Mar'25
Change(%)
Net Sales
25.86
22.65
14.17%
Operating Profit (PBDIT) excl Other Income
0.76
0.71
7.04%
Interest
0.00
0.00
Exceptional Items
0.00
0.00
Standalone Net Profit
0.40
0.51
-21.57%
Operating Profit Margin (Excl OI)
2.94%
3.13%
-0.19%
Values in Rs Cr.
Direction Arrows
Net Sales

YoY Growth in year ended Mar 2026 is 14.17% vs 10.65% in Mar 2025

Direction Arrows
Standalone Net Profit

YoY Growth in year ended Mar 2026 is -21.57% vs 200.00% in Mar 2025

stock-summaryCompany CV
About Dhanvantri Jeevan Rekha Ltd stock-summary
stock-summary
Dhanvantri Jeevan Rekha Ltd
Micro Cap
Healthcare Services
Dhanvantri Jeevan Rekha Limited, incorporated on June 11, 1993 is a multi speciality hospital providing reliable diagnostic and therapeutical services. Dhanvantri Hospital with advance and high-class patient care, made humble beginning around 30 years ago in 1993 at 1- Saket, Meerut. The Hospital has now grown to become a major healthcare provider to all walks of life in Meerut and the surrounding region.
Company Coordinates stock-summary
Company Details
1 Saket , Meerut Uttar Pradesh : 250003
stock-summary
Tel: 91-0121-2648151/2648152
stock-summary
dhanvantrihospital@gmail.com
Registrar Details
Beetal Financial & Computer Services (P) Ltd , Beetal House , 99 Mandangir, 3rd Floor, Behind Local Shopping Centre, Near Dada Harsukhdas Mandir, New Delhi