
Compare Dhruva Cap.Serv. with Similar Stocks
Stock DNA
Non Banking Financial Company (NBFC)
INR 162 Cr (Micro Cap)
385.00
21
0.00%
0.41
1.30%
5.25
Total Returns (Price + Dividend) 
Dhruva Cap.Serv. for the last several years.
Risk Adjusted Returns v/s
Returns Beta

News

Dhruva Capital Services Ltd is Rated Sell
Dhruva Capital Services Ltd is rated Sell by MarketsMOJO, with this rating last updated on 22 June 2026. However, the analysis and financial metrics discussed here reflect the company’s current position as of 18 July 2026, providing investors with the latest insights into its fundamentals, valuation, financial trends, and technical outlook.
Read full news article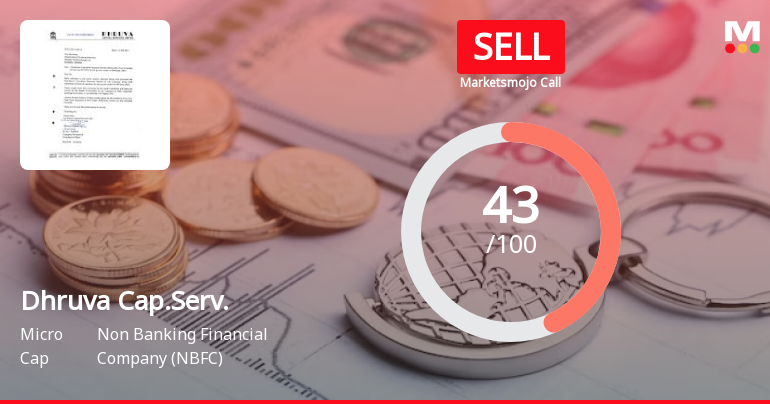
Dhruva Capital Services Ltd is Rated Sell
Dhruva Capital Services Ltd is rated Sell by MarketsMOJO, with this rating last updated on 22 June 2026. However, the analysis and financial metrics discussed here reflect the stock’s current position as of 07 July 2026, providing investors with the latest insights into the company’s performance and outlook.
Read full news article
Dhruva Capital Services Ltd is Rated Sell
Dhruva Capital Services Ltd is rated 'Sell' by MarketsMOJO, with this rating last updated on 22 June 2026. However, the analysis and financial metrics discussed here reflect the stock's current position as of 26 June 2026, providing investors with the most up-to-date view of the company’s fundamentals, valuation, financial trends, and technical outlook.
Read full news article Announcements
Compliances-Certificate under Reg. 74 (5) of SEBI (DP) Regulations 2018
14-Jul-2026 | Source : BSERegulation 74(5) of SEBI Regulation 2018.
Regulation 7 Of SEBI (Prohibition Of Insider Trading) Regulations 2015.
30-Jun-2026 | Source : BSERegulation 7 of SEBI (Prohibition of Insider Trading) Regulation 2015.
Closure of Trading Window
23-Jun-2026 | Source : BSEUnaudited Financial Results of the company for the quarter ended June 30 2026.
Corporate Actions

No Upcoming Board Meetings

No Dividend history available

No Splits history available

No Bonus history available

No Rights history available
Quality key factors
Valuation key factors
Technicals key factors
 Technical Indicator Scale: Bearish, Mildly Bearish, Sideways, Mildly Bullish, Bullish Turned
 Shareholding Snapshot : Jun 2026
Shareholding Compare (%holding)
Non Institution
32.6708
Held by 0 Schemes
Held by 0 FIIs
Shreeram Bagla (30.32%)
Kadayam Ramanathan Bharat (5.7%)
40.93%
Quarterly Results Snapshot (Standalone) - Mar'26 - QoQ

QoQ Growth in quarter ended Mar 2026 is 28.36% vs -14.10% in Dec 2025

QoQ Growth in quarter ended Mar 2026 is -155.48% vs 269.77% in Dec 2025
Half Yearly Results Snapshot (Standalone) - Sep'25
Growth in half year ended Sep 2025 is 53.40% vs 123.91% in Sep 2024
Growth in half year ended Sep 2025 is -257.30% vs -13.59% in Sep 2024
Nine Monthly Results Snapshot (Standalone) - Dec'25
YoY Growth in nine months ended Dec 2025 is 36.36% vs 111.54% in Dec 2024
YoY Growth in nine months ended Dec 2025 is -93.81% vs -24.81% in Dec 2024
Annual Results Snapshot (Standalone) - Mar'26
YoY Growth in year ended Mar 2026 is 46.01% vs 85.22% in Mar 2025
YoY Growth in year ended Mar 2026 is 245.95% vs -126.06% in Mar 2025
About Dhruva Capital Services Ltd

Company Coordinates


