
Compare Dhunseri Vent. with Similar Stocks
Dashboard
With a fall in Operating Profit of -167.67%, the company declared Very Negative results in Dec 25
- The company has declared negative results for the last 4 consecutive quarters
- INTEREST(9M) At Rs 51.33 cr has Grown at 90.96%
- NET SALES(Latest six months) At Rs 140.91 cr has Grown at -45.99%
- PAT(Latest six months) At Rs -6.98 cr has Grown at -45.99%
Despite the size of the company, domestic mutual funds hold only 0.01% of the company
Below par performance in long term as well as near term
Stock DNA
Diversified
INR 867 Cr (Micro Cap)
NA (Loss Making)
42
3.47%
-0.14
1.74%
0.27
Total Returns (Price + Dividend) 
Latest dividend: 3.5 per share ex-dividend date: Feb-27-2026
Risk Adjusted Returns v/s
Returns Beta

News

Dhunseri Ventures Ltd is Rated Sell
Dhunseri Ventures Ltd is rated 'Sell' by MarketsMOJO, with this rating last updated on 15 Apr 2026. However, the analysis and financial metrics discussed here reflect the stock's current position as of 19 May 2026, providing investors with an up-to-date view of the company’s performance and outlook.
Read full news article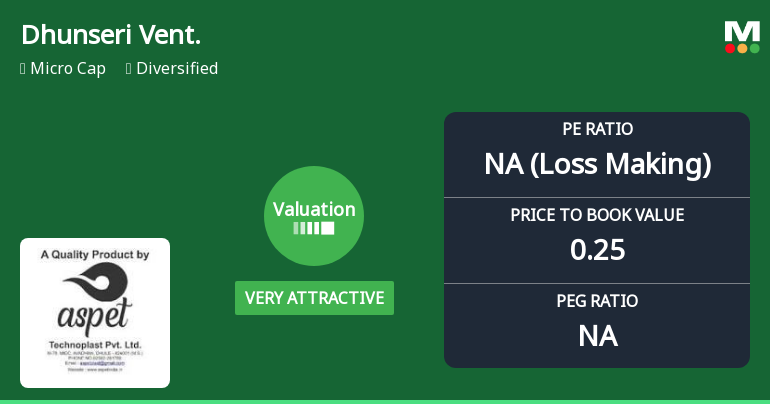
Dhunseri Ventures Ltd Valuation Shifts to Very Attractive Amid Market Challenges
Dhunseri Ventures Ltd has witnessed a significant shift in its valuation parameters, moving from an attractive to a very attractive rating despite ongoing market headwinds and a recent downgrade in its overall mojo grade. This article analyses the company’s current price-to-earnings (P/E) and price-to-book value (P/BV) ratios in comparison to historical levels and peer averages, providing investors with a comprehensive view of its price attractiveness and investment potential.
Read full news article
Dhunseri Ventures Ltd is Rated Sell by MarketsMOJO
Dhunseri Ventures Ltd is rated 'Sell' by MarketsMOJO, with this rating last updated on 15 Apr 2026. However, the analysis and financial metrics discussed here reflect the stock's current position as of 08 May 2026, providing investors with the latest insights into the company’s performance and outlook.
Read full news article Announcements
Board Meeting Intimation for Consideration And Approval Of Audited Financial Results Of The Company For The Year Ended 31St March 2026 And Dividend If Any For The F.Y 2025-2026.
19-May-2026 | Source : BSEDhunseri Ventures Ltd-has informed BSE that the meeting of the Board of Directors of the Company is scheduled on 26/05/2026 inter alia to consider and approve Audited Financial Results of the Company for the year ended 31st March 2026 and dividend if any for the F.Y 2025-2026.
Closure of Trading Window
26-Mar-2026 | Source : BSEIntimation regarding closure of Trading Window
Communication To Members Of The Company On Tax Deduction At Source (TDS) On Interim Dividend For The FY 2025-26
24-Feb-2026 | Source : BSECommunication to Members of the Company on Tax Deduction at Source (TDS) on interim Dividend for the FY 2025-26
Corporate Actions

(26 May 2026)

Dhunseri Ventures Ltd has declared 35% dividend, ex-date: 27 Feb 26

No Splits history available

No Bonus history available

No Rights history available
Quality key factors
Valuation key factors
Technicals key factors
 Technical Indicator Scale: Bearish, Mildly Bearish, Sideways, Mildly Bullish, Bullish Turned
 Shareholding Snapshot : Mar 2026
Shareholding Compare (%holding)
Promoters
None
Held by 1 Schemes (0.0%)
Held by 23 FIIs (0.57%)
Dhunseri Investments Limited (65.23%)
The New India Assurance Company Limited (1.72%)
18.31%
Quarterly Results Snapshot (Consolidated) - Dec'25 - QoQ

QoQ Growth in quarter ended Dec 2025 is 3.54% vs -60.09% in Sep 2025
QoQ Growth in quarter ended Dec 2025 is 156.55% vs -114.99% in Sep 2025
Half Yearly Results Snapshot (Consolidated) - Sep'25

Growth in half year ended Sep 2025 is -17.51% vs 272.09% in Sep 2024
Growth in half year ended Sep 2025 is -56.02% vs 18.41% in Sep 2024
Nine Monthly Results Snapshot (Consolidated) - Dec'25
YoY Growth in nine months ended Dec 2025 is -22.53% vs 201.64% in Dec 2024
YoY Growth in nine months ended Dec 2025 is -71.18% vs 79.58% in Dec 2024
Annual Results Snapshot (Consolidated) - Mar'25
YoY Growth in year ended Mar 2025 is 4.62% vs 73.98% in Mar 2024
YoY Growth in year ended Mar 2025 is -5.83% vs -71.78% in Mar 2024
About Dhunseri Ventures Ltd

Company Coordinates


