
Compare Diamond Power with Similar Stocks
Dashboard
With a Negative Book Value, the company has a Weak Long Term Fundamental Strength
- Poor long term growth as Net Sales has grown by an annual rate of 3.35% and Operating profit at -221.64% over the last 5 years
- The company has a negative book value of Rs 604.20 crore
- The company has been able to generate a Return on Equity (avg) of 2.97% signifying low profitability per unit of shareholders funds
With a growth in Net Sales of 46.78%, the company declared Very Positive results in Mar 26
Risky - Negative Book Value
Despite the size of the company, domestic mutual funds hold only 0.3% of the company
Stock DNA
Other Electrical Equipment
INR 10,658 Cr (Small Cap)
65.00
47
0.00%
-4.03
-26.18%
-16.96
Total Returns (Price + Dividend) 
Latest dividend: 1 per share ex-dividend date: Sep-26-2013
Risk Adjusted Returns v/s
Returns Beta

News

Diamond Power Infrastructure Ltd is Rated Hold by MarketsMOJO
Diamond Power Infrastructure Ltd is rated 'Hold' by MarketsMOJO. This rating was last updated on 14 May 2026, reflecting a shift from a previous 'Sell' stance. However, the analysis and financial metrics presented here are based on the stock's current position as of 08 June 2026, providing investors with the latest insights into the company’s performance and outlook.
Read full news article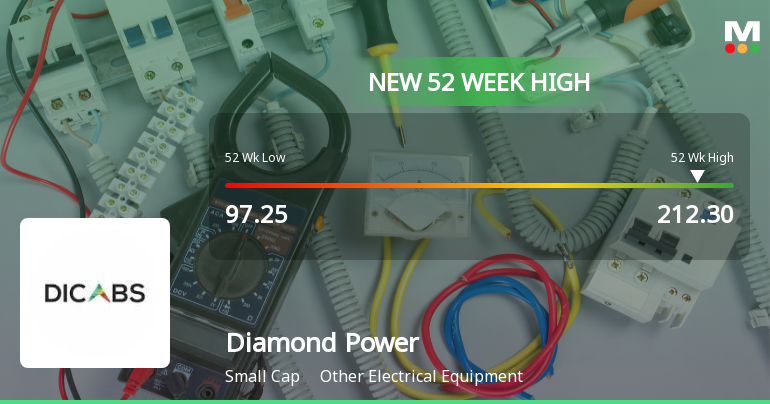
Broad-Based Technical Strength Lifts Diamond Power Infrastructure Ltd to 52-Week High of Rs 212.3
With a decisive break above Rs 212.3 on 8 Jun 2026, Diamond Power Infrastructure Ltd has surged to a fresh 52-week high, extending its remarkable rally that has more than doubled the stock price from Rs 97.25 in the past year.
Read full news article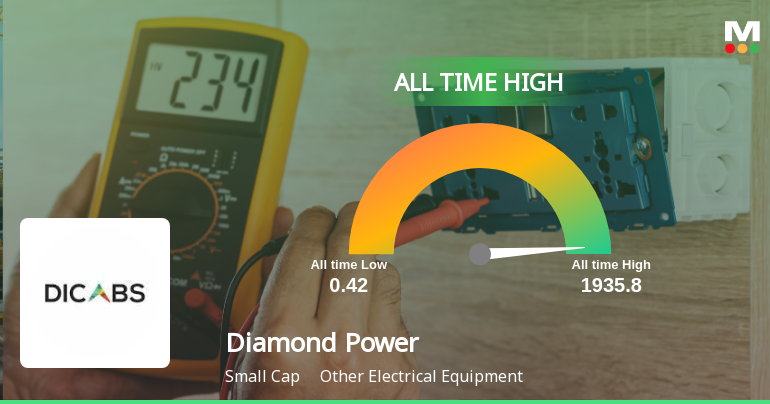
Diamond Power Infrastructure Ltd Hits All-Time High of Rs 210.25 as Momentum Builds Across Timeframes
Extending its winning streak to three consecutive sessions, Diamond Power Infrastructure Ltd surged 3.47% on 8 Jun 2026 to close at Rs 210.25, just 0.4% shy of its 52-week high of Rs 211.10. This rally comes amid broad underperformance in the Sensex, which declined 0.92% on the same day, underscoring the stock’s relative strength in a challenging market environment.
Read full news article Announcements
Disclosure Of Contact Details Of Key Managerial Personnel Of The Company Under Regulation 30(5) Of SEBI (LODR) Regulations 2015
10-Jun-2026 | Source : BSEDisclosure of contact details of Key Managerial Personnel of the Company under regulation 30(5) of SEBI (LODR) Regulation 2015
Board Meeting Outcome for Outcome Of Board Meeting
06-Jun-2026 | Source : BSEDiamond Power Infrastructure Limited has informed the exchange regarding the Change in Management
Announcement under Regulation 30 (LODR)-Change in Management
06-Jun-2026 | Source : BSEDiamond Power Infrastructure Limited has informed the exchange regarding the change in management
Corporate Actions

No Upcoming Board Meetings

Diamond Power Infrastructure Ltd has declared 10% dividend, ex-date: 26 Sep 13

Diamond Power Infrastructure Ltd has announced 1:10 stock split, ex-date: 03 Dec 24

Diamond Power Infrastructure Ltd has announced 1:3 bonus issue, ex-date: 26 Aug 13

No Rights history available
Quality key factors
Valuation key factors
Technicals key factors
 Technical Indicator Scale: Bearish, Mildly Bearish, Sideways, Mildly Bullish, Bullish Turned
 Shareholding Snapshot : Mar 2026
Shareholding Compare (%holding)
Promoters
None
Held by 5 Schemes (0.05%)
Held by 14 FIIs (0.36%)
Gsec Limited (29.68%)
Unitbhai Shantilal Mehta (1.09%)
9.48%
Quarterly Results Snapshot (Consolidated) - Mar'26 - QoQ

QoQ Growth in quarter ended Mar 2026 is 46.78% vs 8.16% in Dec 2025

QoQ Growth in quarter ended Mar 2026 is 21.90% vs 79.30% in Dec 2025
Half Yearly Results Snapshot (Consolidated) - Sep'25
Growth in half year ended Sep 2025 is 56.10% vs 218.23% in Sep 2024
Growth in half year ended Sep 2025 is 132.64% vs 160.58% in Sep 2024
Nine Monthly Results Snapshot (Consolidated) - Dec'25
YoY Growth in nine months ended Dec 2025 is 55.36% vs 274.03% in Dec 2024
YoY Growth in nine months ended Dec 2025 is 263.59% vs 927.97% in Dec 2024
Annual Results Snapshot (Consolidated) - Mar'26
YoY Growth in year ended Mar 2026 is 71.25% vs 224.84% in Mar 2025
YoY Growth in year ended Mar 2026 is 358.46% vs 102.58% in Mar 2025
About Diamond Power Infrastructure Ltd

Company Coordinates


