
Compare Digjam with Similar Stocks
Stock DNA
Garments & Apparels
INR 87 Cr (Micro Cap)
38.00
23
0.00%
13.37
52.71%
20.68
Total Returns (Price + Dividend) 
Digjam for the last several years.
Risk Adjusted Returns v/s
Returns Beta

News

Digjam Ltd is Rated Sell by MarketsMOJO
Digjam Ltd is rated 'Sell' by MarketsMOJO, with this rating last updated on 11 May 2026. However, the analysis and financial metrics presented here reflect the stock's current position as of 04 June 2026, providing investors with an up-to-date view of the company's fundamentals, returns, and technical outlook.
Read full news article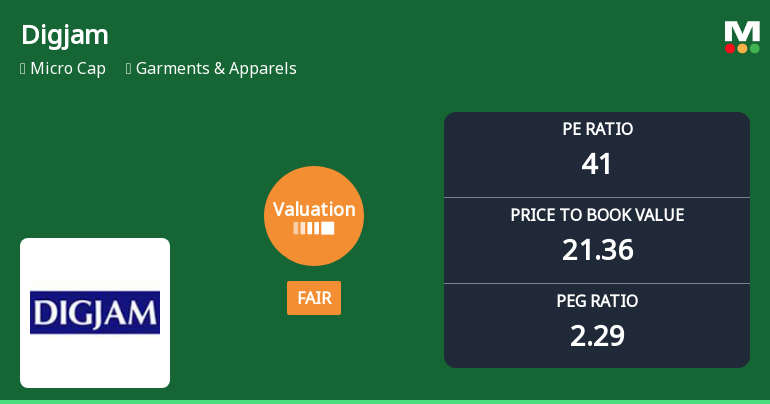
Digjam Ltd Valuation Shifts to Fair: A Detailed Analysis of Price Attractiveness
Digjam Ltd, a micro-cap player in the Garments & Apparels sector, has witnessed a notable shift in its valuation parameters, moving from an expensive to a fair valuation grade. This change is primarily driven by adjustments in its price-to-earnings (P/E) and price-to-book value (P/BV) ratios, reflecting evolving market perceptions amid mixed financial performance and sector dynamics.
Read full news articleAre Digjam Ltd latest results good or bad?
Digjam Ltd's latest financial results for Q4 FY26 reveal a complex picture of operational performance. The company reported net sales of ₹8.21 crores, reflecting a year-on-year growth of 32.85% and a sequential increase of 17.62% from the previous quarter. This recovery follows a significant decline in sales during Q3 FY26, where revenues fell sharply from ₹14.14 crores in Q2 FY26. The volatility in revenue raises concerns about demand consistency and execution challenges. In terms of profitability, Digjam achieved a net profit of ₹1.23 crores in Q4 FY26, marking a substantial year-on-year increase of 146.00%. However, the operating profit margin, which stood at 14.01%, shows a decline from 17.31% in the same quarter last year, indicating potential issues with pricing power or cost management despite the revenue growth. The company's balance sheet presents critical concerns, particularly with a debt-to-eq...
Read full news article Announcements
Compliances-Reg.24(A)-Annual Secretarial Compliance
26-May-2026 | Source : BSEPlease find enclosed Annual Secretarial Compliance Report of the Company for the year ended March 31 2026.
Announcement under Regulation 30 (LODR)-Newspaper Publication
25-May-2026 | Source : BSEDigjam Limited has informed the Stock Exchange about copy of Newspaper Publication For Financial Results for the Quarter and Year Ended March 31 2026.
Announcement under Regulation 30 (LODR)-Change in Management
23-May-2026 | Source : BSEAppointment of Cost Auditor and Internal Auditor for the financial year 2026-27
Corporate Actions

No Upcoming Board Meetings

No Dividend history available

No Splits history available

No Bonus history available

No Rights history available
Quality key factors
Valuation key factors
Technicals key factors
 Technical Indicator Scale: Bearish, Mildly Bearish, Sideways, Mildly Bullish, Bullish Turned
 Shareholding Snapshot : Mar 2026
Shareholding Compare (%holding)
Promoters
None
Held by 2 Schemes (0.0%)
Held by 12 FIIs (1.79%)
Finquest Financial Solutions Pvt. Ltd. (75.0%)
Icici Bank Ltd (1.22%)
17.51%
Quarterly Results Snapshot (Standalone) - Mar'26 - YoY

YoY Growth in quarter ended Mar 2026 is 32.85% vs 108.08% in Mar 2025
YoY Growth in quarter ended Mar 2026 is -120.00% vs 248.98% in Mar 2025
Half Yearly Results Snapshot (Standalone) - Sep'25

Growth in half year ended Sep 2025 is 171.62% vs -52.97% in Sep 2024
Growth in half year ended Sep 2025 is 95.41% vs -116.58% in Sep 2024
Nine Monthly Results Snapshot (Standalone) - Dec'25
YoY Growth in nine months ended Dec 2025 is 108.74% vs -39.77% in Dec 2024
YoY Growth in nine months ended Dec 2025 is 98.25% vs -60.04% in Dec 2024
Annual Results Snapshot (Standalone) - Mar'26
YoY Growth in year ended Mar 2026 is 82.86% vs 619.37% in Mar 2025
YoY Growth in year ended Mar 2026 is 90.57% vs 12.11% in Mar 2025
About Digjam Ltd

Company Coordinates


