
Compare Diligent Indust. with Similar Stocks
Total Returns (Price + Dividend) 
Diligent Indust. for the last several years.
Risk Adjusted Returns v/s
Returns Beta

News
Are Diligent Industries Ltd latest results good or bad?
Diligent Industries Ltd's latest financial results for Q4 FY26 reveal significant operational challenges. The company reported a net profit of ₹0.35 crores, which reflects a year-on-year decline of 20.45%. Revenue for the same quarter was ₹29.85 crores, indicating a dramatic year-on-year decrease of 42.60%. This revenue figure also marks a sequential decline of 16.76% from the previous quarter, highlighting a concerning trend in sales performance. Despite these challenges, there was a marginal improvement in operating margin, which rose to 5.46% from 3.33% in the same quarter last year, suggesting some progress in cost management. However, the overall profitability remains under pressure, as indicated by a thin profit after tax (PAT) margin of 1.17%, which is vulnerable to operational disruptions. The company's return on equity (ROE) stands at a low 4.05%, which is significantly below industry averages, s...
Read full news article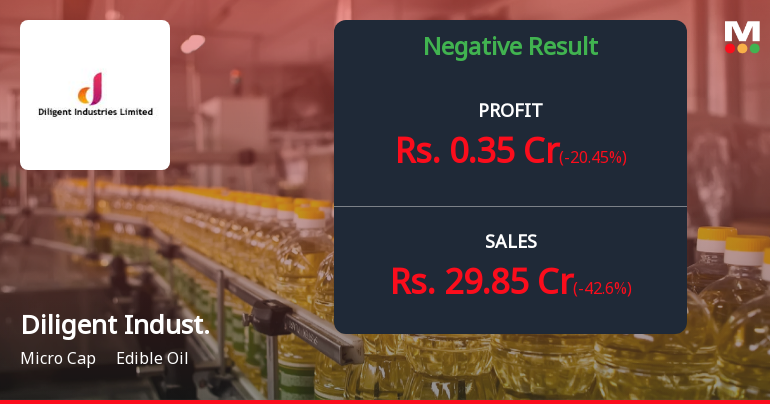
Diligent Industries Q4 FY26: Sharp Revenue Decline Clouds Margin Recovery
Diligent Industries Limited, a micro-cap edible oil manufacturer with a market capitalisation of ₹55.32 crores, reported a challenging fourth quarter for FY26, with net sales plummeting 42.60% year-on-year to ₹29.85 crores. Despite managing to improve operating margins to 5.46%, the sharp revenue contraction resulted in net profit of ₹0.35 crores, marking a 20.45% decline from the previous year's quarter. The stock, currently trading at ₹2.32, has lost 24.68% year-to-date, reflecting investor concerns about the company's growth trajectory.
Read full news article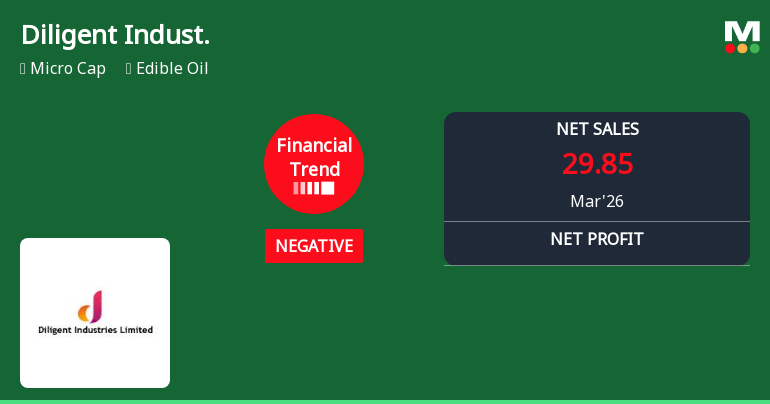
Diligent Industries Ltd Reports Sharp Decline in Quarterly Performance Amid Negative Financial Trend
Diligent Industries Ltd, a micro-cap player in the edible oil sector, has reported a marked deterioration in its financial performance for the quarter ended March 2026. The company’s net sales have hit a low of ₹29.85 crores, reflecting a shift from a previously flat to a negative financial trend, with its financial score plunging from 2 to -6 over the past three months. This downturn comes amid broader challenges in the edible oil industry and contrasts sharply with the performance of benchmark indices such as the Sensex.
Read full news article Announcements
Announcement under Regulation 30 (LODR)-Newspaper Publication
04-Jun-2026 | Source : BSEIntimation of newspaper publication of Q4 and year ended 31.03.2026 Audited Results
Board Meeting Outcome for Outcome Of Board Meeting Q4 31.03.2026 Audited Report
30-May-2026 | Source : BSEOutcome of Board Meeting Q4 31.03.2026 Audited Report
Results For The Quarter And Year Ended 31.03.2026
30-May-2026 | Source : BSEResults for the Quarter and Year Ended Q4 31.03.2026 audited financials.
Corporate Actions

No Upcoming Board Meetings

No Dividend history available

Diligent Industries Ltd has announced 1:5 stock split, ex-date: 19 Apr 22

No Bonus history available

Diligent Industries Ltd has announced 6:5 rights issue, ex-date: 24 Oct 24
Quality key factors
Valuation key factors
Technicals key factors
 Technical Indicator Scale: Bearish, Mildly Bearish, Sideways, Mildly Bullish, Bullish Turned
 Shareholding Snapshot : Mar 2026
Shareholding Compare (%holding)
Promoters
None
Held by 0 Schemes
Held by 0 FIIs
Vankineni Bhanu Prakash (44.52%)
Srinivasa Rao Paturi (5.31%)
35.27%
Quarterly Results Snapshot (Standalone) - Mar'26 - YoY

YoY Growth in quarter ended Mar 2026 is -42.60% vs 1.56% in Mar 2025

YoY Growth in quarter ended Mar 2026 is -20.45% vs -45.00% in Mar 2025
Half Yearly Results Snapshot (Standalone) - Sep'25
Growth in half year ended Sep 2025 is 44.14% vs 25.14% in Sep 2024
Growth in half year ended Sep 2025 is 2.58% vs 108.60% in Sep 2024
Nine Monthly Results Snapshot (Standalone) - Dec'25
YoY Growth in nine months ended Dec 2025 is 34.46% vs 28.79% in Dec 2024
YoY Growth in nine months ended Dec 2025 is 4.33% vs 70.49% in Dec 2024
Annual Results Snapshot (Standalone) - Mar'26
YoY Growth in year ended Mar 2026 is 6.54% vs 17.39% in Mar 2025
YoY Growth in year ended Mar 2026 is 0.00% vs 24.14% in Mar 2025
About Diligent Industries Ltd

Company Coordinates


