
Compare Dilip Buildcon with Similar Stocks
Dashboard
Weak Long Term Fundamental Strength with a -2.73% CAGR growth in Operating Profits over the last 5 years
- Low ability to service debt as the company has a high Debt to EBITDA ratio of 4.55 times
- The company has been able to generate a Return on Equity (avg) of 3.23% signifying low profitability per unit of shareholders funds
Negative results in Mar 26
Falling Participation by Institutional Investors
Stock DNA
Construction
INR 6,642 Cr (Small Cap)
14.00
44
0.25%
1.12
6.97%
0.97
Total Returns (Price + Dividend) 
Latest dividend: 1 per share ex-dividend date: Sep-08-2025
Risk Adjusted Returns v/s
Returns Beta

News
Dilip Buildcon Ltd. Technical Momentum Shifts Amid Bearish Signals
Dilip Buildcon Ltd., a small-cap player in the construction sector, has experienced a notable shift in its technical momentum, with key indicators signalling a bearish outlook. The company’s stock price has declined to ₹418.15, down 1.80% from the previous close of ₹425.80, reflecting growing investor caution amid weakening technical trends and a downgrade in its Mojo Grade to Strong Sell.
Read full news article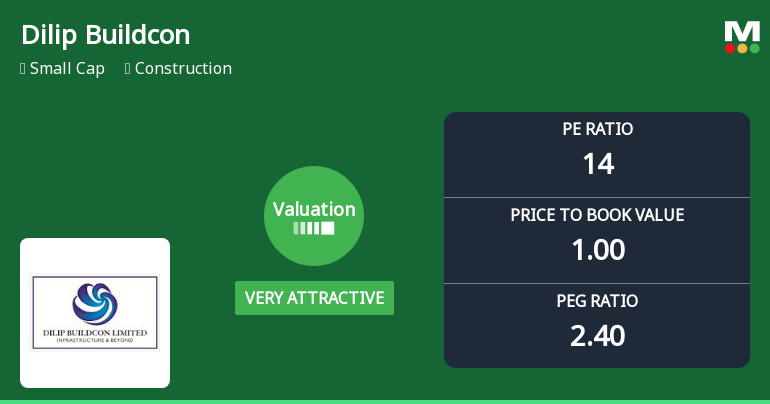
Dilip Buildcon Ltd: Valuation Shifts Signal Renewed Price Attractiveness Amid Sector Challenges
Dilip Buildcon Ltd., a small-cap player in the construction sector, has witnessed a notable shift in its valuation parameters, moving from an attractive to a very attractive rating. Despite recent price declines and sector headwinds, the company’s improved price-to-earnings and price-to-book ratios relative to peers and historical averages suggest a compelling entry point for discerning investors.
Read full news article
Dilip Buildcon Ltd. is Rated Strong Sell
Dilip Buildcon Ltd. is rated Strong Sell by MarketsMOJO, with this rating last updated on 14 May 2026. However, the analysis and financial metrics discussed here reflect the company’s current position as of 11 July 2026, providing investors with the most recent and relevant data to assess the stock’s outlook.
Read full news article Announcements
Dilip Buildcon Limited - Updates
09-Dec-2019 | Source : NSEDilip Buildcon Limited has informed the Exchange regarding 'Issue of Completion Certificate for the project "Development to four lanes with paved shoulders of Shahkot-Moga section of NH-71 (New NH No. 703) from existing Km, 44.60 to, 77.20 including construction of Dharamkot Bypass in the state of Punjab under NHDP-IV on EPC mode'.
Dilip Buildcon Limited - Other General Purpose
26-Nov-2019 | Source : NSEDilip Buildcon Limited has informed the Exchange regardingá disclosure of the Related Party Transactions for the half year ended September 30, 2019 pursuant to Regulation 23(9) of the SEBI (LODR) Regulations, 2015
Dilip Buildcon Limited - Updates
21-Nov-2019 | Source : NSEDilip Buildcon Limited has informed the Exchange regarding 'Issue of Provisional Completion Certificate (completed 190 days prior) for the project Four Laning of Wardha-Butibori Section of NH-361 from km 465.500 to km 524.690 (design length 59.190 km) under NH (O) in the State of Maharashtra on Hybrid Annuity Mode.
Corporate Actions

No Upcoming Board Meetings

Dilip Buildcon Ltd. has declared 10% dividend, ex-date: 08 Sep 25

No Splits history available

No Bonus history available

No Rights history available
Quality key factors
Valuation key factors
Technicals key factors
 Technical Indicator Scale: Bearish, Mildly Bearish, Sideways, Mildly Bullish, Bullish Turned
 Shareholding Snapshot : Mar 2026
Shareholding Compare (%holding)
Promoters
14.1626
Held by 6 Schemes (2.07%)
Held by 62 FIIs (1.97%)
Dilip Suryavanshi (33.92%)
None
11.88%
Quarterly Results Snapshot (Consolidated) - Mar'26 - YoY

YoY Growth in quarter ended Mar 2026 is -25.72% vs -8.01% in Mar 2025
YoY Growth in quarter ended Mar 2026 is -63.68% vs 3,099.06% in Mar 2025
Half Yearly Results Snapshot (Consolidated) - Sep'25
Growth in half year ended Sep 2025 is -18.75% vs -3.01% in Sep 2024
Growth in half year ended Sep 2025 is 15.72% vs 336.26% in Sep 2024
Nine Monthly Results Snapshot (Consolidated) - Dec'25
YoY Growth in nine months ended Dec 2025 is -18.34% vs -5.33% in Dec 2024

YoY Growth in nine months ended Dec 2025 is 163.90% vs 149.08% in Dec 2024
Annual Results Snapshot (Consolidated) - Mar'26
YoY Growth in year ended Mar 2026 is -20.61% vs -5.79% in Mar 2025
YoY Growth in year ended Mar 2026 is 103.23% vs 230.27% in Mar 2025
About Dilip Buildcon Ltd.

Company Coordinates


