
Compare Dish TV India with Similar Stocks
Dashboard
With a Negative Book Value, the company has a Weak Long Term Fundamental Strength
- Company's ability to service its debt is weak with a poor EBIT to Interest (avg) ratio of 1.17
With a fall in Operating Profit of -274.58%, the company declared Very Negative results in Mar 26
Risky - Negative EBITDA
Falling Participation by Institutional Investors
Consistent Underperformance against the benchmark over the last 3 years
Stock DNA
Media & Entertainment
INR 569 Cr (Micro Cap)
NA (Loss Making)
15
0.00%
0.03
16.42%
-0.14
Total Returns (Price + Dividend) 
Latest dividend: 0.5 per share ex-dividend date: Nov-05-2018
Risk Adjusted Returns v/s
Returns Beta

News
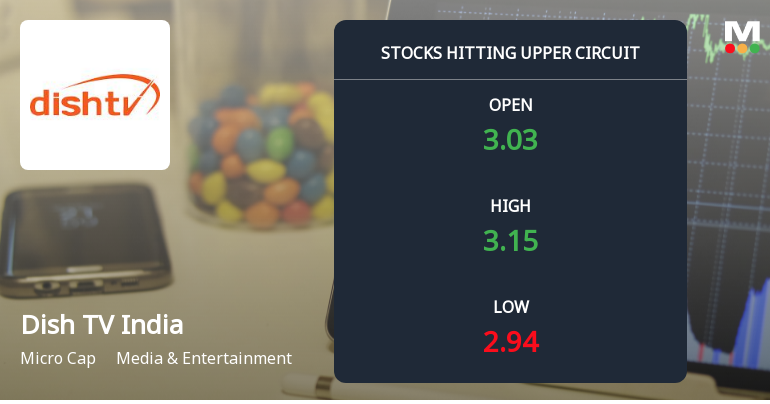
Dish TV India Ltd Locks at Upper Circuit With 2.32% Gain — Buyers Queue, Sellers Absent
At Rs 3.17, the buying was done — not because demand dried up, but because the exchange wouldn't let the stock go any higher. Dish TV India Ltd locked at its upper circuit of 2.32% on 2 Jul 2026, with buyers queuing and no sellers willing to part with shares.
Read full news article
Dish TV India Ltd is Rated Strong Sell
Dish TV India Ltd is rated Strong Sell by MarketsMOJO. This rating was last updated on 04 March 2024. However, the analysis and financial metrics discussed below reflect the stock’s current position as of 01 July 2026, providing investors with an up-to-date view of the company’s fundamentals, returns, and overall outlook.
Read full news article
Dish TV India Ltd is Rated Strong Sell
Dish TV India Ltd is rated Strong Sell by MarketsMOJO, with this rating last updated on 04 Mar 2024. However, the analysis and financial metrics discussed here reflect the company’s current position as of 20 June 2026, providing investors with an up-to-date view of its fundamentals, returns, and market standing.
Read full news article Announcements
Dish TV India Limited - Credit Rating
09-Dec-2019 | Source : NSEDish TV India Limited has informed the Exchange regarding Credit Rating
Dish TV India Limited - Updates
15-Nov-2019 | Source : NSEDish TV India Limited has informed the Exchange regarding 'This is in continuation to our communication dated November 14, 2019, wherein the Company had duly submitted the Un-audited Financial Results of the Company for the second quarter and six months period ended on September 30, 2019 of the financial year 2019-20, in the format specified under Regulation 33 of the Securities and Exchange Board of India (Listing Obligation and Disclosure Requirements) Regulations, 2015 together with the Earning Release and Limited Review Report of Auditors (on Standalone and Consolidated financial statements).
Dish TV India Limited - Limited Review Report
14-Nov-2019 | Source : NSEDish TV India Limited has informed the Exchange regarding Limited Review Report for the Quarter ended September 30, 2019
Corporate Actions

No Upcoming Board Meetings

Dish TV India Ltd has declared 50% dividend, ex-date: 05 Nov 18

No Splits history available

No Bonus history available

Dish TV India Ltd has announced 121:100 rights issue, ex-date: 08 Oct 08
Quality key factors
Valuation key factors
Technicals key factors
 Technical Indicator Scale: Bearish, Mildly Bearish, Sideways, Mildly Bullish, Bullish Turned
 Shareholding Snapshot : Mar 2026
Shareholding Compare (%holding)
Non Institution
11.6119
Held by 0 Schemes
Held by 43 FIIs (8.23%)
Jsgg Infra Developers Llp (1.47%)
J C Flowers Asset Reconstruction Private Limited (24.19%)
42.27%
Quarterly Results Snapshot (Consolidated) - Mar'26 - QoQ

QoQ Growth in quarter ended Mar 2026 is -18.72% vs 2.72% in Dec 2025

QoQ Growth in quarter ended Mar 2026 is -10.04% vs -108.24% in Dec 2025
Half Yearly Results Snapshot (Consolidated) - Sep'25
Growth in half year ended Sep 2025 is -27.08% vs -13.11% in Sep 2024
Growth in half year ended Sep 2025 is -483.41% vs -250.06% in Sep 2024
Nine Monthly Results Snapshot (Consolidated) - Dec'25
YoY Growth in nine months ended Dec 2025 is -24.87% vs -15.57% in Dec 2024
YoY Growth in nine months ended Dec 2025 is -488.92% vs -469.72% in Dec 2024
Annual Results Snapshot (Consolidated) - Mar'26
YoY Growth in year ended Mar 2026 is -25.84% vs -15.56% in Mar 2025
YoY Growth in year ended Mar 2026 is -65.56% vs 75.20% in Mar 2025
About Dish TV India Ltd

Company Coordinates


