
 Price Point
Compare Disha Resources with Similar Stocks
ScoreDashboard
With a Operating Losses, the company has a Weak Long Term Fundamental Strength
- Poor long term growth as Net Sales has grown by an annual rate of -14.74%
Flat results in Jun 26
Risky - Negative EBITDA
Reducing Promoter Confidence
Mojo ParametersStock DNA

Diversified Commercial Services

INR 26 Cr (Micro Cap)

NA (Loss Making)
20

0.00%

0.00

-0.13%

1.14
Total ReturnsTotal Returns (Price + Dividend) 
Disha Resources for the last several years.
Risk Adjusted Returns v/s
Returns Beta
 News & Corporate Actions
News
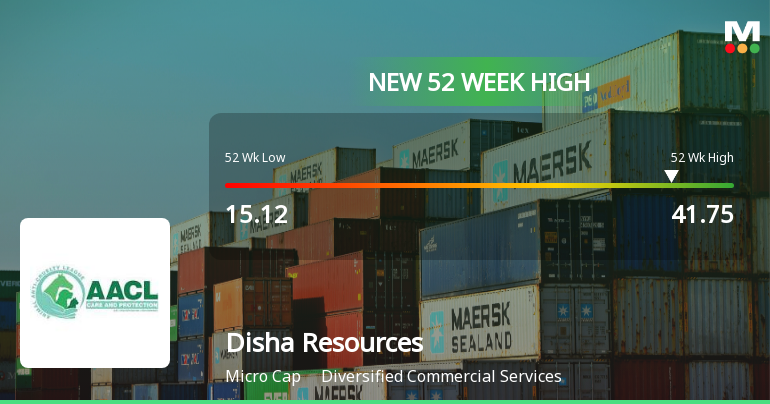
Broad-Based Technical Strength Lifts Disha Resources Ltd to 52-Week High of Rs 41.75
Surging past its previous peaks, Disha Resources Ltd touched a new 52-week high of Rs 41.75 on 10 Sep 2026, marking a remarkable rally of 118.79% over the past year. This milestone comes amid a backdrop of sustained technical momentum, with the stock outperforming its sector and the broader market despite a subdued Sensex environment.
Read full news article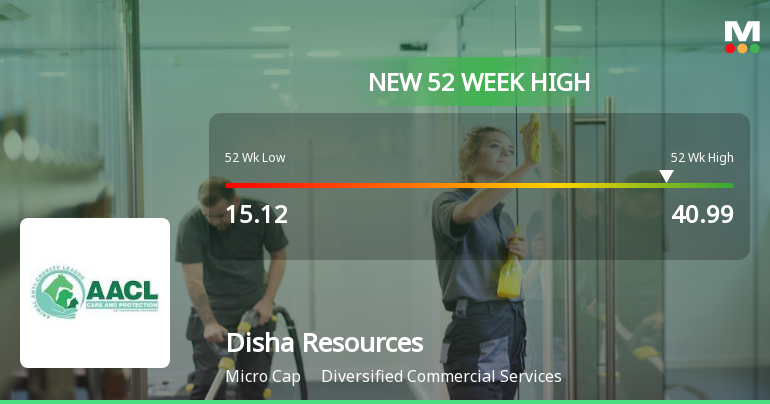
Broad-Based Technical Strength Lifts Disha Resources Ltd to 52-Week High of Rs 40.99
Surging past its previous peak, Disha Resources Ltd reached a new 52-week high of Rs 40.99 on 09 Sep 2026, marking a remarkable rally of over 111% from its 52-week low of Rs 15.12. This milestone comes amid a backdrop of strong technical momentum, with the stock outperforming its sector and maintaining gains over eight consecutive sessions.
Read full news article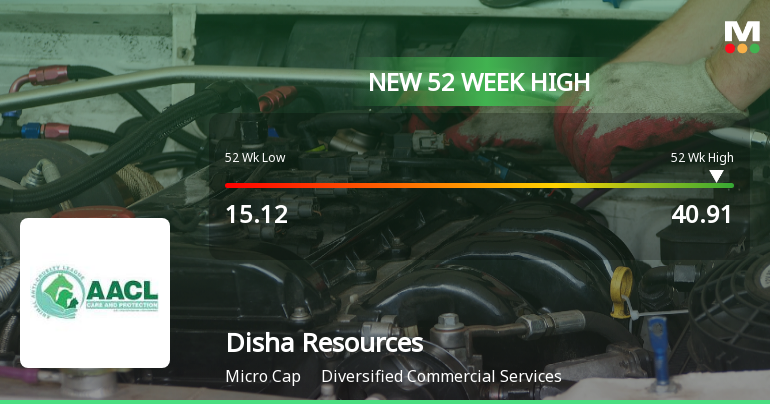
Broad-Based Technical Strength Lifts Disha Resources Ltd to 52-Week High of Rs 40.91
Surging past its previous peaks, Disha Resources Ltd touched a new 52-week high of Rs 40.91 on 26 Aug 2026, marking a remarkable 100% gain over the past year. This milestone comes amid a sustained rally that has seen the stock climb steadily for 10 consecutive sessions, reflecting strong price momentum and a confluence of bullish technical indicators.
Read full news article Announcements
Announcement under Regulation 30 (LODR)-Newspaper Publication
01-Sep-2026 | Source : BSENewspaper Publication of 31st Annual General Meeting Notice
Notice Of The 31St Annual General Meeting For The Financial Year 2025-26
31-Aug-2026 | Source : BSEPlease find attached the Notice of 31st Annual General Meeting of the company which is scheduled to be held on Friday 25th September 2026 at 12:00 p.m. at the registered office of the company.
Letter To Shareholder Stating Weblink For Annual Report - Regulation 36(1)(B) Of SEBI (LODR) Regulations 2015
31-Aug-2026 | Source : BSEPlease find attached Letter pursuant to Regulation 36(1)(b) of SEBI (LODR) Regulations 2015 providing web link of the Annual report for the F.Y. 2025-26
Corporate Actions

No Upcoming Board Meetings

No Dividend history available

No Splits history available

No Bonus history available

No Rights history available
Key FactorsQuality key factors
Valuation key factors
Technicals key factors
 Technical Indicator Scale: Bearish, Mildly Bearish, Sideways, Mildly Bullish, Bullish Turned Shareholding
Shareholding Snapshot : Jun 2026
Shareholding Compare (%holding)
Non Institution
None
Held by 0 Schemes
Held by 0 FIIs
Mayadevi Krishnavtar Kabra (12.61%)
Bhagwan Agarwal (4.1%)
42.02%
FinancialQuarterly Results Snapshot (Standalone) - Jun'26 - QoQ
 Compare with Peers
QoQ Growth in quarter ended Jun 2026 is 52.08% vs 2.13% in Mar 2026

QoQ Growth in quarter ended Jun 2026 is -187.50% vs 366.67% in Mar 2026

Half Yearly Results Snapshot (Standalone) - Sep'25
Growth in half year ended Sep 2025 is 1,533.33% vs -97.87% in Sep 2024
Growth in half year ended Sep 2025 is 74.07% vs -111.54% in Sep 2024
Nine Monthly Results Snapshot (Standalone) - Dec'25
YoY Growth in nine months ended Dec 2025 is 3,100.00% vs -97.87% in Dec 2024
YoY Growth in nine months ended Dec 2025 is 81.82% vs -123.81% in Dec 2024
Annual Results Snapshot (Standalone) - Mar'26
YoY Growth in year ended Mar 2026 is 4,700.00% vs -97.87% in Mar 2025
YoY Growth in year ended Mar 2026 is 94.74% vs -118.87% in Mar 2025
 Company CV
About Disha Resources Ltd










