
Compare Divgi Torq with Similar Stocks
Stock DNA
Auto Components & Equipments
INR 2,491 Cr (Small Cap)
53.00
35
0.32%
-0.47
7.72%
4.07
Total Returns (Price + Dividend) 
Latest dividend: 2.6 per share ex-dividend date: Sep-08-2025
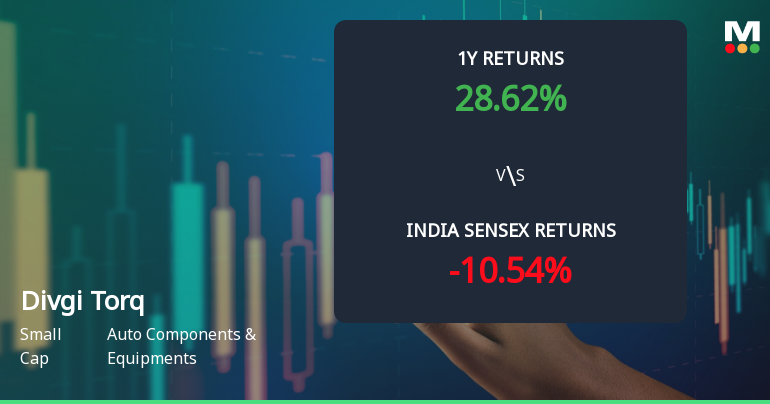
Risk Adjusted Returns v/s
Returns Beta

News
Divgi Torqtransfer Systems Ltd Technical Momentum Shifts Signal Bullish Outlook
Divgi Torqtransfer Systems Ltd, a small-cap player in the Auto Components & Equipments sector, has recently exhibited a notable shift in its technical momentum, upgrading from a mildly bullish to a bullish trend. This change is underpinned by a combination of positive signals from key technical indicators such as MACD, moving averages, and Bollinger Bands, signalling renewed investor interest despite a minor day decline of 1.15%.
Read full news article
Divgi Torqtransfer Systems Ltd is Rated Buy
Divgi Torqtransfer Systems Ltd is rated 'Buy' by MarketsMOJO, with this rating last updated on 26 May 2026. However, the analysis and financial metrics discussed below reflect the stock’s current position as of 07 June 2026, providing investors with the most up-to-date view of the company’s performance and prospects.
Read full news article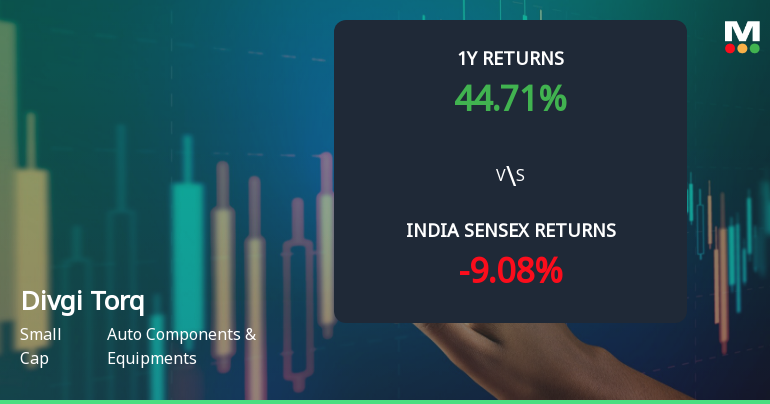
Divgi Torqtransfer Systems Ltd: Technical Momentum Shifts Signal Mildly Bullish Outlook
Divgi Torqtransfer Systems Ltd, a small-cap player in the Auto Components & Equipments sector, has experienced a nuanced shift in its technical momentum, reflecting a transition from a bullish to a mildly bullish trend. Despite a slight dip in the stock price, the company’s technical indicators present a complex picture that investors should carefully analyse amid broader market conditions.
Read full news article Announcements
Announcement under Regulation 30 (LODR)-Change in Management
10-Jun-2026 | Source : BSEAppointment of Mr. Kishor Hole as Chief Information Officer of the Company
Announcement under Regulation 30 (LODR)-Analyst / Investor Meet - Intimation
08-Jun-2026 | Source : BSEAttached herewith is the Analyst/Investor meet intimation scheduled on June 11 2026
Announcement under Regulation 30 (LODR)-Earnings Call Transcript
02-Jun-2026 | Source : BSEAttached herewith is the Earnings Call Transcript for Earnings Call held on May 27 2026.
Corporate Actions

No Upcoming Board Meetings

Divgi Torqtransfer Systems Ltd has declared 52% dividend, ex-date: 08 Sep 25

No Splits history available

No Bonus history available

No Rights history available
Quality key factors
Valuation key factors
Technicals key factors
 Technical Indicator Scale: Bearish, Mildly Bearish, Sideways, Mildly Bullish, Bullish Turned
 Shareholding Snapshot : Mar 2026
Shareholding Compare (%holding)
Promoters
None
Held by 4 Schemes (12.36%)
Held by 16 FIIs (1.97%)
Divgi Holding Pvt Ltd (51.68%)
Oman India Joint Investment Fund Ii (12.19%)
7.53%
Quarterly Results Snapshot (Standalone) - Mar'26 - QoQ

QoQ Growth in quarter ended Mar 2026 is 18.76% vs 9.22% in Dec 2025
QoQ Growth in quarter ended Mar 2026 is 31.52% vs 9.49% in Dec 2025
Half Yearly Results Snapshot (Standalone) - Sep'25
Growth in half year ended Sep 2025 is 42.94% vs -13.66% in Sep 2024
Growth in half year ended Sep 2025 is 42.61% vs -34.78% in Sep 2024
Nine Monthly Results Snapshot (Standalone) - Dec'25
YoY Growth in nine months ended Dec 2025 is 52.63% vs -14.68% in Dec 2024
YoY Growth in nine months ended Dec 2025 is 65.18% vs -37.64% in Dec 2024
Annual Results Snapshot (Standalone) - Mar'26
YoY Growth in year ended Mar 2026 is 61.20% vs -13.61% in Mar 2025
YoY Growth in year ended Mar 2026 is 92.41% vs -38.63% in Mar 2025
About Divgi Torqtransfer Systems Ltd

Company Coordinates


