
Compare DMCC Speciality with Similar Stocks
Dashboard
Poor long term growth as Operating profit has grown by an annual rate 10.65% of over the last 5 years
Flat results in Mar 26
With ROCE of 14.4, it has a Very Attractive valuation with a 2.1 Enterprise value to Capital Employed
Despite the size of the company, domestic mutual funds hold only 0.02% of the company
Consistent Underperformance against the benchmark over the last 3 years
Stock DNA
Specialty Chemicals
INR 614 Cr (Micro Cap)
22.00
41
1.05%
0.33
11.01%
2.40
Total Returns (Price + Dividend) 
Latest dividend: 2.5 per share ex-dividend date: Aug-22-2025
Risk Adjusted Returns v/s
Returns Beta

News

DMCC Speciality Chemicals Ltd Upgraded to Hold as Technicals Improve Amid Mixed Financials
DMCC Speciality Chemicals Ltd has seen its investment rating upgraded from Sell to Hold, reflecting a nuanced improvement in technical indicators and valuation metrics despite ongoing challenges in financial trends and long-term growth. This reassessment comes amid a mixed performance backdrop, with the company showing signs of stabilisation in market momentum and attractive valuation compared to peers.
Read full news article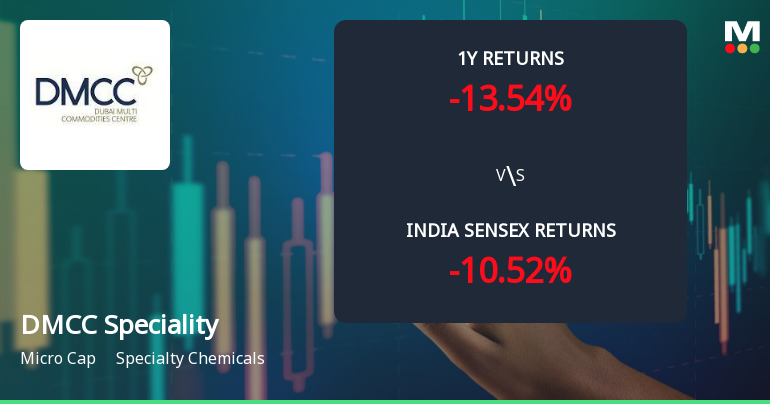
DMCC Speciality Chemicals Ltd Technical Momentum Shifts Amid Mixed Market Signals
DMCC Speciality Chemicals Ltd has experienced a notable shift in its technical momentum, moving from a mildly bearish stance to a sideways trend as of mid-June 2026. Despite a recent downgrade in daily price performance, the stock’s technical indicators present a complex picture, with bullish signals on some timeframes counterbalanced by bearish cues on others. This nuanced technical landscape warrants close attention from investors navigating the specialty chemicals sector.
Read full news article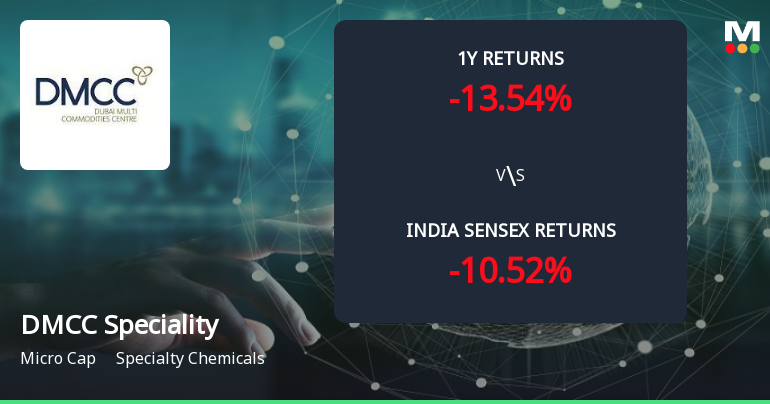
Golden Cross Forms in DMCC Speciality Chemicals Ltd Amid Mixed Technical Signals
The 50-day moving average has crossed above the 200-day moving average for DMCC Speciality Chemicals Ltd, signalling a golden cross on 11 Jun 2026. Yet, the stock fell 3.06% on the day the cross formed, while monthly technical indicators remain bearish. This divergence between the moving averages and other signals calls for a detailed examination of the cross's reliability.
Read full news article Announcements
Announcement under Regulation 30 (LODR)-Earnings Call Transcript
25-May-2026 | Source : BSEAs per attachment.
Compliances-Reg.24(A)-Annual Secretarial Compliance
21-May-2026 | Source : BSESubmission of Annual Secretarial Compliance Report for the Financial year 2025-26
Announcement under Regulation 30 (LODR)-Analyst / Investor Meet - Outcome
19-May-2026 | Source : BSESubmission of Audio Recording of Earning Conference Call held on Tuesday May 19 2026 on the Financial Performance of Q4FY26 with investors and analysts.
Corporate Actions

No Upcoming Board Meetings

DMCC Speciality Chemicals Ltd has declared 25% dividend, ex-date: 22 Aug 25

No Splits history available

No Bonus history available

No Rights history available
Quality key factors
Valuation key factors
Technicals key factors
 Technical Indicator Scale: Bearish, Mildly Bearish, Sideways, Mildly Bullish, Bullish Turned
 Shareholding Snapshot : Mar 2026
Shareholding Compare (%holding)
Promoters
None
Held by 1 Schemes (0.01%)
Held by 2 FIIs (0.13%)
Laxmikumar Narottam Goculdas (36.27%)
Girish Gulati (huf) (2.28%)
33.03%
Quarterly Results Snapshot (Consolidated) - Mar'26 - YoY

YoY Growth in quarter ended Mar 2026 is 41.86% vs 49.14% in Mar 2025

YoY Growth in quarter ended Mar 2026 is 18.24% vs 12.13% in Mar 2025
Half Yearly Results Snapshot (Consolidated) - Sep'25
Growth in half year ended Sep 2025 is 34.58% vs 16.00% in Sep 2024
Growth in half year ended Sep 2025 is 88.16% vs 30.31% in Sep 2024
Nine Monthly Results Snapshot (Consolidated) - Dec'25
YoY Growth in nine months ended Dec 2025 is 31.97% vs 26.15% in Dec 2024
YoY Growth in nine months ended Dec 2025 is 30.76% vs 158.59% in Dec 2024
Annual Results Snapshot (Consolidated) - Mar'26
YoY Growth in year ended Mar 2026 is 34.84% vs 31.51% in Mar 2025
YoY Growth in year ended Mar 2026 is 26.94% vs 85.76% in Mar 2025
About DMCC Speciality Chemicals Ltd

Company Coordinates


