
Compare DNOW, Inc. with Similar Stocks
Dashboard
1
Company has a low Debt to Equity ratio (avg) at times
2
Healthy long term growth as Operating profit has grown by an annual rate 46.82%
3
Flat results in Jun 25
4
With ROE of 8.60%, it has a fair valuation with a 1.37 Price to Book Value
5
Below par performance in long term as well as near term
Total Returns (Price + Dividend) 
TimePeriod
Price Return
Dividend Return
Total Return
3 Months
-4.98%
0%
-4.98%
6 Months
-5.17%
0%
-5.17%
1 Year
2.54%
0%
2.54%
2 Years
39.84%
0%
39.84%
3 Years
28.04%
0%
28.04%
4 Years
31.87%
0%
31.87%
5 Years
68.38%
0%
68.38%
DNOW, Inc. for the last several years.
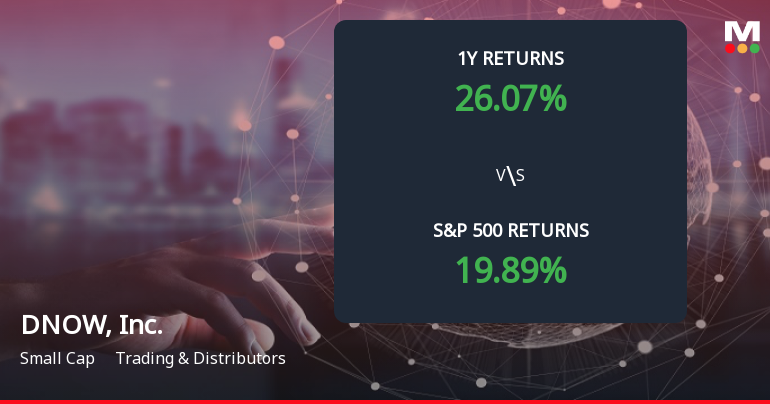
Risk Adjusted Returns v/s
News
DNOW, Inc. Forms Death Cross, Signaling Potential Bearish Trend Ahead
DNOW, Inc. has recently encountered a technical event known as a Death Cross, indicating a potential bearish trend. Current indicators reflect a bearish outlook, with moving averages and MACD showing weakness. Despite recent challenges, DNOW has outperformed the S&P 500 over the past year, though its one-month performance has declined.
Read full news article Announcements

No announcement available
Corporate Actions
No corporate action available
Quality key factors
Factor
Value
Sales Growth (5y)
0.34%
EBIT Growth (5y)
46.82%
EBIT to Interest (avg)
81.00
Debt to EBITDA (avg)
0
Net Debt to Equity (avg)
-0.18
Sales to Capital Employed (avg)
2.24
Tax Ratio
26.96%
Dividend Payout Ratio
0
Pledged Shares
0
Institutional Holding
100.00%
ROCE (avg)
12.69%
ROE (avg)
10.42%
Valuation key factors
Factor
Value
P/E Ratio
16
Industry P/E
Price to Book Value
1.37
EV to EBIT
10.08
EV to EBITDA
7.85
EV to Capital Employed
1.45
EV to Sales
0.56
PEG Ratio
NA
Dividend Yield
NA
ROCE (Latest)
14.36%
ROE (Latest)
8.60%
Technicals key factors
Indicator
Weekly
Monthly
MACD
Mildly Bullish
Mildly Bearish
RSI
No Signal
No Signal
Bollinger Bands
Bearish
Mildly Bearish
Moving Averages
Mildly Bearish (Daily)
KST
Mildly Bullish
Mildly Bearish
Dow Theory
No Trend
Mildly Bullish
OBV
No Trend
Mildly Bullish
 Technical Indicator Scale: Bearish, Mildly Bearish, Sideways, Mildly Bullish, Bullish Turned
 Shareholding Snapshot : Mar 2025
Shareholding Compare (%holding)
Majority shareholders
Domestic Funds
Domestic Funds
Held in 83 Schemes (54.48%)
Foreign Institutions
Held by 124 Foreign Institutions (13.65%)
Strategic Entities with highest holding
Highest Public shareholder
Quarterly Results Snapshot (Consolidated) - Jun'25 - QoQ
Jun'25
Mar'25
Change(%)
Net Sales
628.00
599.00
4.84%
Operating Profit (PBDIT) excl Other Income
49.00
44.00
11.36%
Interest
0.00
0.00
Exceptional Items
-7.00
-3.00
-133.33%
Consolidate Net Profit
25.00
22.00
13.64%
Operating Profit Margin (Excl OI)
62.10%
55.10%
0.70%
USD in Million.

Net Sales
QoQ Growth in quarter ended Jun 2025 is 4.84% vs 4.90% in Mar 2025

Consolidated Net Profit
QoQ Growth in quarter ended Jun 2025 is 13.64% vs -4.35% in Mar 2025
Annual Results Snapshot (Consolidated) - Dec'24
Dec'24
Dec'23
Change(%)
Net Sales
2,373.00
2,321.00
2.24%
Operating Profit (PBDIT) excl Other Income
153.00
174.00
-12.07%
Interest
0.00
0.00
Exceptional Items
-7.00
-8.00
12.50%
Consolidate Net Profit
81.00
244.00
-66.80%
Operating Profit Margin (Excl OI)
50.10%
63.80%
-1.37%
USD in Million.
Net Sales
YoY Growth in year ended Dec 2024 is 2.24% vs 8.66% in Dec 2023
Consolidated Net Profit
YoY Growth in year ended Dec 2024 is -66.80% vs 92.13% in Dec 2023
About DNOW, Inc.

DNOW, Inc.
Trading & Distributors
NOW Inc. (NOW) is a global distributor to the oil and gas and industrial markets. The Company operates under the DistributionNOW and Wilson Export brands. Its segments include the United States, Canada and International. As of December 31, 2016, its segments, the United States, Canada and International, had over 200, 55 and 35 locations, respectively. The United States segment comprises United States Energy, United States Supply Chain and United States Process Solutions. NOW's energy product offerings are used in the oil and gas industry, including upstream drilling and completion, exploration and production, midstream infrastructure development and downstream petroleum refining, as well as in other industries, such as chemical processing, power generation and industrial manufacturing operations. It provides supply chain management to drilling contractors, exploration and production (E&P) operators, midstream operators, downstream energy and industrial manufacturing companies.
Company Coordinates
Company Details
7402 N Eldridge Pkwy , HOUSTON TX : 77041-1902


Registrar Details
InfinHub Market Technologies FZ-LLC, Building-2, Unit 112, Dubai Internet City, Dubai, United Arab Emirates
GET THE MARKETSMOJO APP


Company
Stocks
Portfolio


"Investment in securities markets are subject to market risk. Read all the related documents carefully before investing."