
Compare Dollar Industrie with Similar Stocks
Dashboard
Poor long term growth as Net Sales has grown by an annual rate of 12.65% and Operating profit at 5.47% over the last 5 years
Flat results in Mar 26
Despite the size of the company, domestic mutual funds hold only 0% of the company
Below par performance in long term as well as near term
Stock DNA
Garments & Apparels
INR 1,395 Cr (Small Cap)
13.00
23
1.23%
0.31
11.32%
1.46
Total Returns (Price + Dividend) 
Latest dividend: 3 per share ex-dividend date: Jul-18-2025
Risk Adjusted Returns v/s
Returns Beta

News

Dollar Industries Ltd Faces Intensified Bearish Momentum Amid Technical Downgrade
Dollar Industries Ltd, a small-cap player in the Garments & Apparels sector, has experienced a marked shift in technical momentum, with key indicators signalling a deterioration in price strength. The company’s MarketsMOJO grade was downgraded from Hold to Sell on 5 January 2026, reflecting growing bearish sentiment amid sustained price weakness and negative technical trends.
Read full news article
Dollar Industries Ltd is Rated Sell
Dollar Industries Ltd is rated 'Sell' by MarketsMOJO, with this rating last updated on 05 Jan 2026. However, the analysis and financial metrics discussed here reflect the stock's current position as of 10 June 2026, providing investors with an up-to-date view of the company's fundamentals, returns, and market performance.
Read full news article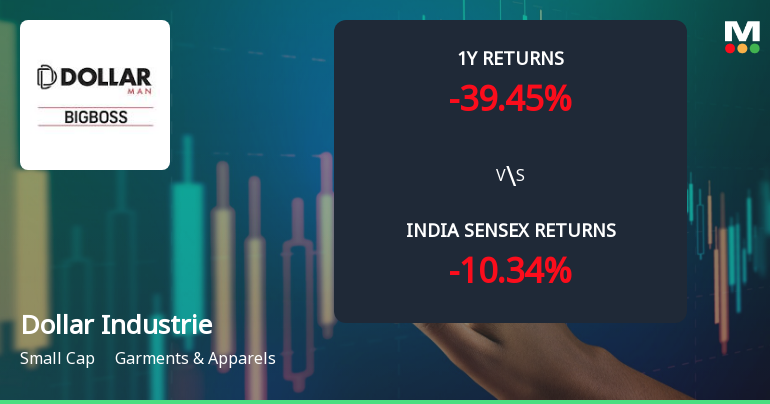
Dollar Industries Ltd Technical Momentum Shifts Amid Bearish Sentiment
Dollar Industries Ltd, a small-cap player in the Garments & Apparels sector, has experienced a notable shift in its technical momentum, reflecting a complex interplay of bearish and mildly bullish signals. Despite a marginal day change of 0.02% to close at ₹246.20, the stock’s technical indicators reveal a nuanced picture that investors should carefully analyse amid broader market pressures.
Read full news article Announcements
Announcement under Regulation 30 (LODR)-Newspaper Publication
05-Jun-2026 | Source : BSEPlease find enclosed Newspaper Publication w.r.t Transfer and Dematerialization of physical securities via SEBI Circular dated 30th January 2026
Announcement under Regulation 30 (LODR)-Earnings Call Transcript
29-May-2026 | Source : BSEPlease find enclosed Transcript of Earning Call held on 25th May 2026
Compliances-Reg.24(A)-Annual Secretarial Compliance
29-May-2026 | Source : BSEPlease find enclosed Annual Secretarial Compliance Report for the F.Y. ended 31st March 2026
Corporate Actions

No Upcoming Board Meetings

Dollar Industries Ltd has declared 150% dividend, ex-date: 28 Jul 26

Dollar Industries Ltd has announced 2:10 stock split, ex-date: 31 Aug 17

No Bonus history available

No Rights history available
Quality key factors
Valuation key factors
Technicals key factors
 Technical Indicator Scale: Bearish, Mildly Bearish, Sideways, Mildly Bullish, Bullish Turned
 Shareholding Snapshot : Mar 2026
Shareholding Compare (%holding)
Promoters
None
Held by 1 Schemes (0.0%)
Held by 28 FIIs (4.98%)
Dollar Holdings Private Limited (46.28%)
Fidelity Funds - Asian Smaller Companies (3.18%)
13.09%
Quarterly Results Snapshot (Consolidated) - Mar'26 - YoY

YoY Growth in quarter ended Mar 2026 is 13.19% vs 9.83% in Mar 2025
YoY Growth in quarter ended Mar 2026 is 11.38% vs -11.60% in Mar 2025
Half Yearly Results Snapshot (Consolidated) - Sep'25
Growth in half year ended Sep 2025 is 11.58% vs 5.38% in Sep 2024
Growth in half year ended Sep 2025 is 35.08% vs 6.14% in Sep 2024
Nine Monthly Results Snapshot (Consolidated) - Dec'25
YoY Growth in nine months ended Dec 2025 is 8.44% vs 8.30% in Dec 2024
YoY Growth in nine months ended Dec 2025 is 21.14% vs 8.19% in Dec 2024
Annual Results Snapshot (Consolidated) - Mar'26
YoY Growth in year ended Mar 2026 is 9.97% vs 8.79% in Mar 2025
YoY Growth in year ended Mar 2026 is 18.00% vs 0.93% in Mar 2025
About Dollar Industries Ltd

Company Coordinates


