
Compare Dollex Agrotech with Similar Stocks
Total Returns (Price + Dividend) 
Dollex Agrotech for the last several years.
Risk Adjusted Returns v/s
Returns Beta

News
Are Dollex Agrotech Ltd latest results good or bad?
Dollex Agrotech Ltd's latest financial results for the quarter ending March 2026 reveal a complex picture of operational performance. The company reported a significant quarter-on-quarter revenue surge of 298.79%, reaching ₹108.59 crores, which reflects its ability to capitalize on seasonal demand in the fertiliser sector. However, this impressive sequential growth is contrasted by an 8.49% decline in revenue compared to the same quarter last year, raising concerns about the sustainability of this growth momentum. Net profit for the quarter was ₹4.64 crores, marking a substantial 177.84% increase from the previous quarter, indicating a recovery from prior operational struggles. Yet, the year-on-year comparison shows a staggering increase of 2,629.41% from ₹0.17 crores in Q4 FY25, which highlights the challenges faced in the previous year rather than a consistent improvement in operational efficiency. The ...
Read full news article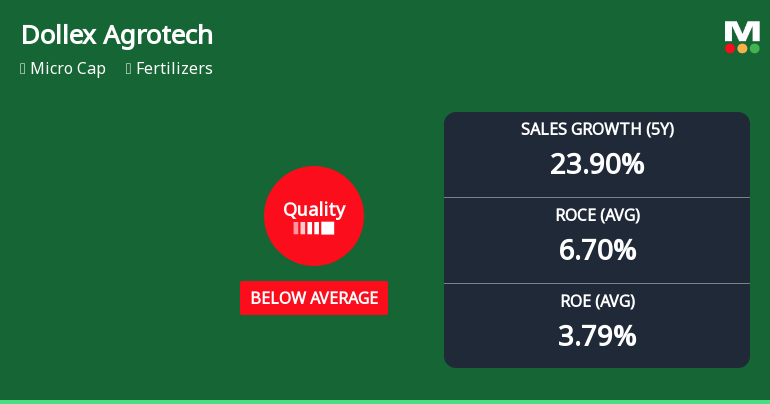
Dollex Agrotech Ltd Quality Grade Downgrade Highlights Fundamental Challenges
Dollex Agrotech Ltd, a micro-cap player in the fertilisers sector, has seen its quality grade downgraded from average to below average as of 19 Jan 2026, reflecting deteriorating business fundamentals. Despite a recent uptick in share price, the company faces significant challenges in profitability, leverage, and operational efficiency, which have weighed on investor sentiment and long-term returns.
Read full news article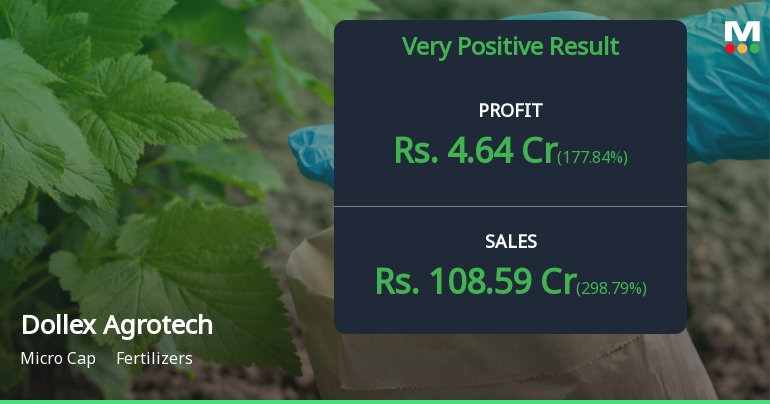
Dollex Agrotech Q4 FY26: Strong Quarter Masks Underlying Fragility
Dollex Agrotech Ltd., a micro-cap fertiliser manufacturer with a market capitalisation of ₹132.00 crores, delivered an impressive fourth quarter performance in FY26, posting net profit of ₹4.64 crores—a dramatic turnaround from the previous quarter's ₹1.67 crores. However, this stellar quarter-on-quarter growth of 177.84% obscures a more concerning year-on-year narrative, as the company's stock continues to languish 25.42% below its 52-week high of ₹44.25, trading at ₹33.00 following a modest 4.93% gain in the latest session.
Read full news article Announcements
Corporate Actions

No Upcoming Board Meetings

No Dividend history available

No Splits history available

No Bonus history available

No Rights history available
Quality key factors
Valuation key factors
Technicals key factors
 Technical Indicator Scale: Bearish, Mildly Bearish, Sideways, Mildly Bullish, Bullish Turned
 Shareholding Snapshot : Mar 2026
Shareholding Compare (%holding)
Promoters
88.4533
Held by 0 Schemes
Held by 0 FIIs
Mehmood Khan (27.01%)
Sudhakar Narayan Sanku (2.94%)
36.72%
Quarterly Results Snapshot (Standalone) - Mar'26 - QoQ

QoQ Growth in quarter ended Mar 2026 is 298.79% vs -48.74% in Dec 2025

QoQ Growth in quarter ended Mar 2026 is 177.84% vs 363.89% in Dec 2025
Half Yearly Results Snapshot (Standalone) - Sep'25
Growth in half year ended Sep 2025 is -42.98% vs 93.96% in Mar 2025
Growth in half year ended Sep 2025 is -46.31% vs -9.66% in Mar 2025
Nine Monthly Results Snapshot (Standalone) - Dec'25
YoY Growth in nine months ended Dec 2025 is -1.85% vs -27.90% in Dec 2024
YoY Growth in nine months ended Dec 2025 is -42.11% vs -17.03% in Dec 2024
Annual Results Snapshot (Standalone) - Mar'26
YoY Growth in year ended Mar 2026 is -5.17% vs 75.24% in Mar 2025
YoY Growth in year ended Mar 2026 is 1.69% vs 17.95% in Mar 2025
About Dollex Agrotech Ltd

Company Coordinates


