
Compare Doms Industries with Similar Stocks
Stock DNA
Miscellaneous
INR 13,828 Cr (Small Cap)
59.00
40
0.14%
0.07
18.87%
11.22
Total Returns (Price + Dividend) 
Latest dividend: 3.1 per share ex-dividend date: Sep-15-2025
Risk Adjusted Returns v/s
Returns Beta

News

Doms Industries Ltd Sees Mixed Technical Signals Amid Price Momentum Shift
Doms Industries Ltd, a small-cap player in the miscellaneous sector, has experienced a notable shift in price momentum, reflected in a 6.32% gain on 12 June 2026. Despite this intraday surge, technical indicators present a complex picture, with a transition from bearish to mildly bearish trends and mixed signals across key oscillators and moving averages. This analysis delves into the recent technical developments and their implications for investors.
Read full news article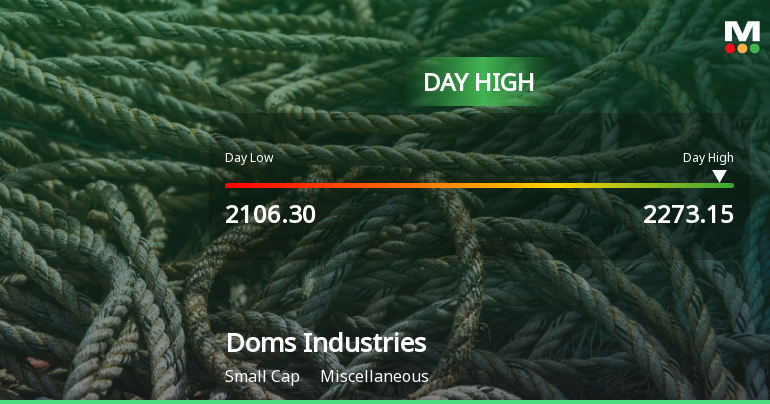
Doms Industries Ltd Surges 7.01% to Day's High of Rs 2252.15 — Outperforms Sector by 6.59 Percentage Points
The Sensex rose 0.41% on 11 Jun 2026, yet Doms Industries Ltd outpaced the broader market with a 7.01% gain, outperforming its sector by 6.59 percentage points. This sharp single-session rally marks the third consecutive day of gains, cumulatively lifting the stock by 7.92% over this period and signalling a notable shift in its short-term momentum.
Read full news article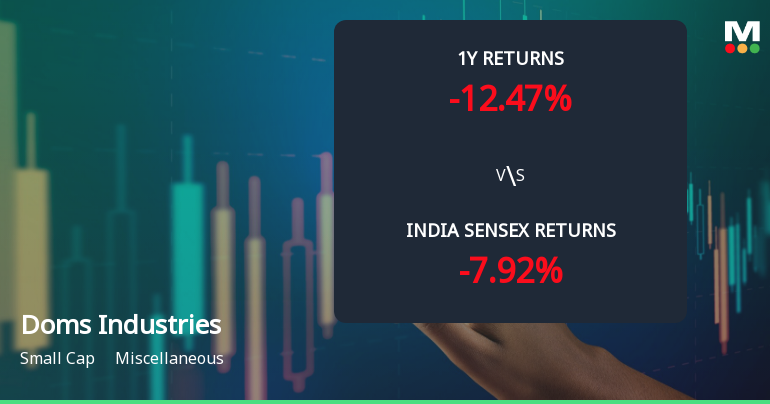
Doms Industries Ltd Faces Bearish Momentum Amid Technical Downturn
Doms Industries Ltd, a small-cap player in the miscellaneous sector, has experienced a notable shift in its technical momentum, with key indicators signalling a bearish trend. The stock’s recent downgrade from a Hold to a Sell rating reflects deteriorating market sentiment and technical weakness, underscored by declining price action and subdued relative strength compared to benchmark indices.
Read full news article Announcements
Announcement under Regulation 30 (LODR)-Earnings Call Transcript
21-May-2026 | Source : BSETranscript of Investor Conference Call on the Audited Financial Results for the financial year ended March 31 2026
Announcement under Regulation 30 (LODR)-Newspaper Publication
20-May-2026 | Source : BSENewspaper Advertisement in relation to the Audited Financial Results for the financial year ended March 31 2026
Announcement Under Regulation 30 Of SEBI LODR Regulations 2015
20-May-2026 | Source : BSEDisclosure of Events/ Information under Regulation 30 of SEBI LODR Regulations 2015
Corporate Actions

No Upcoming Board Meetings

Doms Industries Ltd has declared 31% dividend, ex-date: 15 Sep 25

No Splits history available

No Bonus history available

No Rights history available
Quality key factors
Valuation key factors
Technicals key factors
 Technical Indicator Scale: Bearish, Mildly Bearish, Sideways, Mildly Bullish, Bullish Turned
 Shareholding Snapshot : Mar 2026
Shareholding Compare (%holding)
Promoters
None
Held by 26 Schemes (16.63%)
Held by 96 FIIs (7.61%)
Fila - Fabbrica Italiana Lapis Ed Affini Spa (26.01%)
Sbi Mutual Fund (5.88%)
2.49%
Quarterly Results Snapshot (Consolidated) - Mar'26 - QoQ

QoQ Growth in quarter ended Mar 2026 is 1.99% vs 4.28% in Dec 2025
QoQ Growth in quarter ended Mar 2026 is -2.00% vs -0.63% in Dec 2025
Half Yearly Results Snapshot (Consolidated) - Sep'25

Growth in half year ended Sep 2025 is 25.19% vs 18.51% in Sep 2024
Growth in half year ended Sep 2025 is 12.00% vs 46.07% in Sep 2024
Nine Monthly Results Snapshot (Consolidated) - Dec'25
YoY Growth in nine months ended Dec 2025 is 22.69% vs 23.86% in Dec 2024
YoY Growth in nine months ended Dec 2025 is 12.70% vs 42.54% in Dec 2024
Annual Results Snapshot (Consolidated) - Mar'26
YoY Growth in year ended Mar 2026 is 21.63% vs 24.43% in Mar 2025
YoY Growth in year ended Mar 2026 is 13.76% vs 32.13% in Mar 2025
About Doms Industries Ltd

Company Coordinates


