
Compare Donaldson Co., Inc. with Similar Stocks
Dashboard
High Management Efficiency with a high ROCE of 27.80%
Strong ability to service debt as the company has a low Debt to EBITDA ratio of 0.72 times
Poor long term growth as Net Sales has grown by an annual rate of 7.41% and Operating profit at 10.85% over the last 5 years
Flat results in Jul 25
With ROCE of 28.41%, it has a very expensive valuation with a 5.34 Enterprise value to Capital Employed
High Institutional Holdings at 91%
Market Beating Performance
Stock DNA
Auto Components & Equipments
USD 11,799 Million (Small Cap)
24.00
NA
0.95%
0.31
29.06%
7.78
Total Returns (Price + Dividend) 
Donaldson Co., Inc. for the last several years.
Risk Adjusted Returns v/s
News

Donaldson Co., Inc. Hits New 52-Week High of $90.77
Donaldson Co., Inc. achieved a new 52-week high of USD 90.77, reflecting strong performance in the auto components industry with a one-year gain of 22.39%. The company, with a market cap of USD 11,752 million, shows solid financial health, including a P/E ratio of 24.00 and a debt-to-equity ratio of 0.34.
Read full news article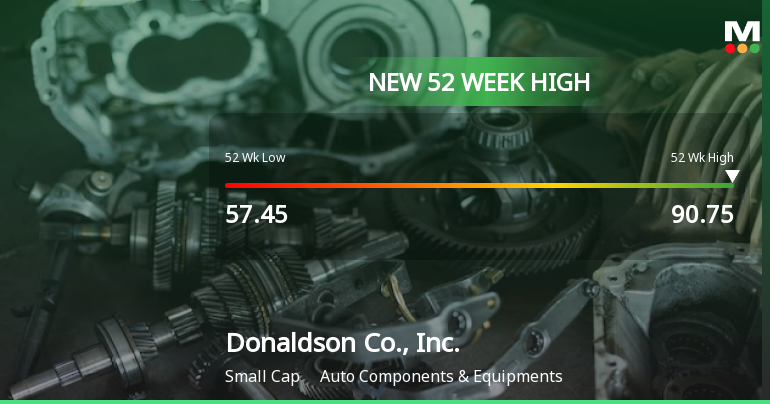
Donaldson Co., Inc. Hits New 52-Week High at $90.75
Donaldson Co., Inc. has achieved a new 52-week high, reflecting its strong performance in the auto components industry. With a market capitalization of USD 11,752 million, the company demonstrates solid financial health, characterized by a favorable P/E ratio, high return on equity, and a conservative debt-to-equity ratio.
Read full news article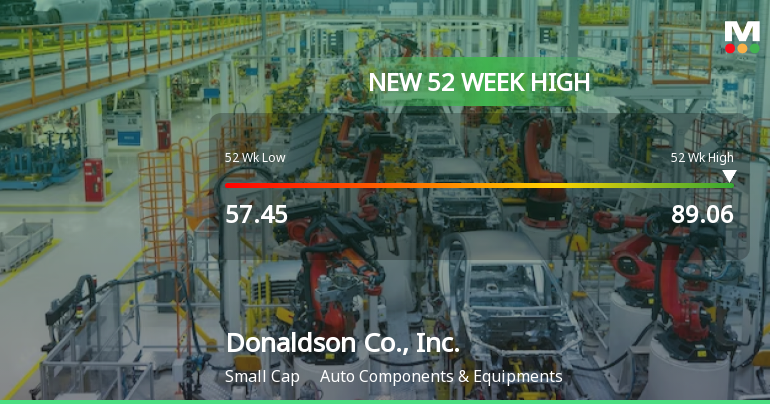
Donaldson Co., Inc. Hits New 52-Week High of $89.06
Donaldson Co., Inc. has achieved a new 52-week high, reflecting strong performance with a notable increase over the past year. The company, classified as small-cap with a market capitalization of USD 11,752 million, maintains a solid financial structure and offers a dividend yield of 1.18%.
Read full news article Announcements

Corporate Actions
Quality key factors
Valuation key factors
Technicals key factors
 Technical Indicator Scale: Bearish, Mildly Bearish, Sideways, Mildly Bullish, Bullish Turned
 Shareholding Snapshot : Oct 2025
Shareholding Compare (%holding)
Domestic Funds
Held in 108 Schemes (37.44%)
Held by 185 Foreign Institutions (11.09%)
Quarterly Results Snapshot (Consolidated) - Jul'25 - YoY

YoY Growth in quarter ended Jul 2025 is 4.84% vs 6.36% in Jul 2024
YoY Growth in quarter ended Jul 2025 is 4.19% vs 19.37% in Jul 2024
Annual Results Snapshot (Consolidated) - Jul'24

YoY Growth in year ended Jul 2024 is 4.53% vs 3.76% in Jul 2023
YoY Growth in year ended Jul 2024 is 15.38% vs 7.81% in Jul 2023
About Donaldson Co., Inc.

Company Coordinates


