
Compare Dr Agarwal's Hea with Similar Stocks
Dashboard
Strong ability to service debt as the company has a low Debt to EBITDA ratio of 1.87 times
Healthy long term growth as Net Sales has grown by an annual rate of 26.90%
The company has declared Positive results for the last 5 consecutive quarters
With ROCE of 10.4, it has a Expensive valuation with a 5.3 Enterprise value to Capital Employed
High Institutional Holdings at 65.77%
Market Beating Performance
Total Returns (Price + Dividend) 
Dr Agarwal's Hea for the last several years.
Risk Adjusted Returns v/s
Returns Beta

News
Dr Agarwals Health Care Ltd is Rated Hold by MarketsMOJO
Dr Agarwals Health Care Ltd is rated 'Hold' by MarketsMOJO, with this rating last updated on 18 March 2026. However, the analysis and financial metrics discussed here reflect the company’s current position as of 04 June 2026, providing investors with the latest insights into its performance and outlook.
Read full news article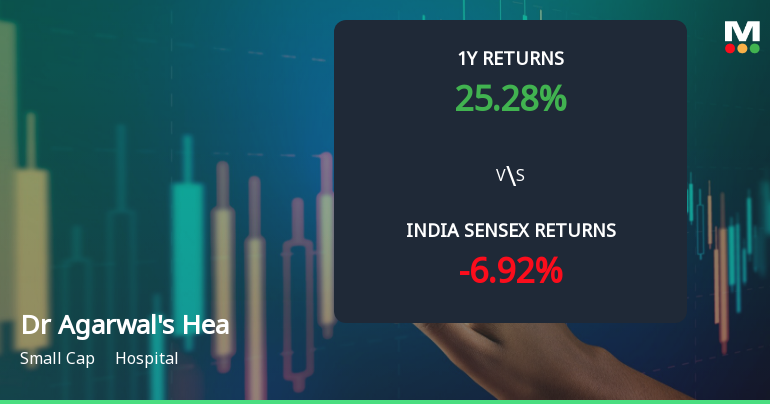
Dr Agarwals Health Care Ltd Technical Momentum Shifts Amid Mixed Market Signals
Dr Agarwals Health Care Ltd, a small-cap player in the hospital sector, has experienced a subtle shift in its technical momentum, moving from a sideways trend to a mildly bearish stance. Despite a modest day gain of 0.25%, the stock’s technical indicators present a nuanced picture, reflecting both bullish and bearish signals across different timeframes and metrics.
Read full news article
Dr Agarwals Health Care Ltd is Rated Hold
Dr Agarwals Health Care Ltd is rated 'Hold' by MarketsMOJO, with this rating last updated on 18 Mar 2026. However, the analysis and financial metrics discussed here reflect the stock's current position as of 24 May 2026, providing investors with an up-to-date view of its fundamentals, returns, and overall outlook.
Read full news article Announcements
Corporate Actions

No Upcoming Board Meetings

No Dividend history available

No Splits history available

No Bonus history available

No Rights history available
Quality key factors
Valuation key factors
Technicals key factors
 Technical Indicator Scale: Bearish, Mildly Bearish, Sideways, Mildly Bullish, Bullish Turned
 Shareholding Snapshot : Mar 2026
Shareholding Compare (%holding)
FIIs
None
Held by 15 Schemes (5.87%)
Held by 69 FIIs (57.94%)
Ashvin Agarwal (4.45%)
Hyperion Investments Pte. Ltd. (23.1%)
1.68%
Quarterly Results Snapshot (Consolidated) - Mar'26 - QoQ

QoQ Growth in quarter ended Mar 2026 is 6.46% vs 6.25% in Dec 2025
QoQ Growth in quarter ended Mar 2026 is 17.69% vs 13.64% in Dec 2025
Half Yearly Results Snapshot (Consolidated) - Sep'25

Growth in half year ended Sep 2025 is 20.25% vs 26.05% in Sep 2024
Growth in half year ended Sep 2025 is 109.17% vs 16.62% in Sep 2024
Nine Monthly Results Snapshot (Consolidated) - Dec'25
YoY Growth in nine months ended Dec 2025 is 21.20% vs 2.97% in Dec 2024
YoY Growth in nine months ended Dec 2025 is 83.65% vs -20.72% in Dec 2024
Annual Results Snapshot (Consolidated) - Mar'26
YoY Growth in year ended Mar 2026 is 21.57% vs 28.44% in Mar 2025
YoY Growth in year ended Mar 2026 is 59.59% vs 0.48% in Mar 2025
About Dr Agarwals Health Care Ltd

Company Coordinates


