
Compare DRC Systems with Similar Stocks
Dashboard
High Management Efficiency with a high ROE of 21.27%
The company is Net-Debt Free
Healthy long term growth as Net Sales has grown by an annual rate of 55.05% and Operating profit at 66.30%
Positive results in Mar 26
With ROE of 17.8, it has a Very Attractive valuation with a 1.8 Price to Book Value
Majority shareholders : Non Institution
Underperformed the market in the last 1 year
Stock DNA
Computers - Software & Consulting
INR 210 Cr (Micro Cap)
10.00
20
0.00%
-0.02
17.85%
1.84
Total Returns (Price + Dividend) 
DRC Systems for the last several years.
Risk Adjusted Returns v/s
Returns Beta

News
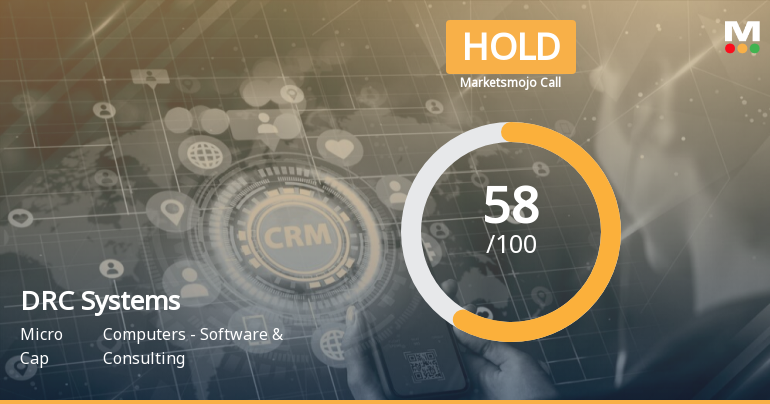
DRC Systems India Ltd is Rated Hold
DRC Systems India Ltd is rated 'Hold' by MarketsMOJO, with this rating last updated on 04 Feb 2026. However, the analysis and financial metrics discussed here reflect the stock's current position as of 29 May 2026, providing investors with an up-to-date view of the company’s fundamentals, returns, and market standing.
Read full news articleAre DRC Systems India Ltd latest results good or bad?
DRC Systems India Ltd's latest financial results for Q4 FY26 present a mixed operational picture, highlighting both growth in revenue and challenges in profitability. The company reported consolidated net sales of ₹27.20 crores, reflecting a marginal increase of 0.07% from the previous quarter and a robust year-on-year growth of 60.66%. This performance indicates the company's ability to secure new business and expand its client base within a competitive IT services landscape. However, the consolidated net profit for the same period was ₹5.16 crores, which represents a sequential decline of 5.49% compared to the previous quarter, although it still shows a year-on-year increase of 17.01%. This decline raises concerns about the sustainability of profit levels, especially as operating margins contracted to 29.67%, down from 35.56% a year earlier. The decline in margins can be attributed to rising employee cos...
Read full news article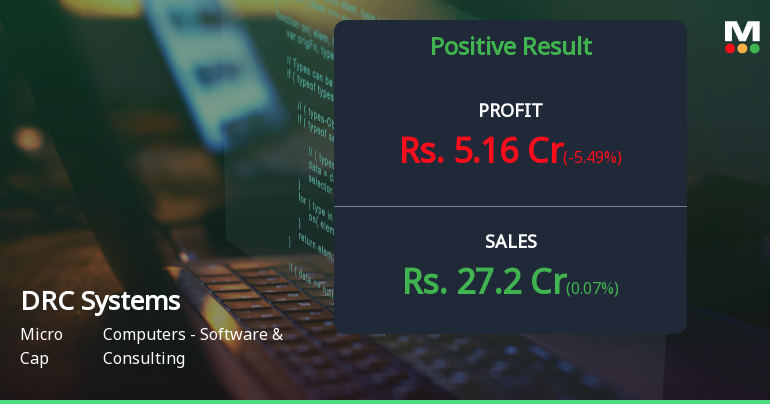
DRC Systems India Q4 FY26: Strong Revenue Growth Masks Margin Pressure and Profit Decline
DRC Systems India Limited, a micro-cap IT services and consulting firm with a market capitalisation of ₹216.00 crores, reported a mixed performance for the quarter ended March 2026, with robust revenue growth overshadowed by a sequential decline in consolidated net profit. The company's net sales for Q4 FY26 stood at ₹27.20 crores, marking a marginal quarter-on-quarter growth of 0.07% but a strong year-on-year surge of 60.66%. However, consolidated net profit declined 5.49% sequentially to ₹5.16 crores, raising concerns about profitability sustainability despite the topline expansion.
Read full news article Announcements
Statement Of Deviation(S) Or Variation(S) In Utilisation Of Funds Raised Through Preferential Issue For The Quarter Ended March 31 2026
18-May-2026 | Source : BSEStatement of Deviation(s) or Variation(s) in utilisation of funds raised through Preferential Issue for the quarter ended March 31 2026.
Board Meeting Outcome for Audited (Standalone And Consolidated) Financial Results And Investment
18-May-2026 | Source : BSEOutcome of Board Meeting for Audited (Standalone And Consolidated) Financial Results for the quarter and year ended on March 31 2026 and Investment in Skizzle Technolabs India Private Limited.
Announcement under Regulation 30 (LODR)-Acquisition
18-May-2026 | Source : BSEInvestment in Skizzle Technolabs India Private Limited.
Corporate Actions

No Upcoming Board Meetings

No Dividend history available

DRC Systems India Ltd has announced 1:10 stock split, ex-date: 16 Mar 22

DRC Systems India Ltd has announced 2:1 bonus issue, ex-date: 27 Feb 24

No Rights history available
Quality key factors
Valuation key factors
Technicals key factors
 Technical Indicator Scale: Bearish, Mildly Bearish, Sideways, Mildly Bullish, Bullish Turned
 Shareholding Snapshot : Mar 2026
Shareholding Compare (%holding)
Non Institution
None
Held by 0 Schemes
Held by 1 FIIs (0.0%)
Yogeshkumar Popatbhai Sutariya (9.38%)
Pirimid Technologies Private Limited (9.28%)
37.91%
Quarterly Results Snapshot (Consolidated) - Mar'26 - QoQ

QoQ Growth in quarter ended Mar 2026 is 0.07% vs 19.05% in Dec 2025
QoQ Growth in quarter ended Mar 2026 is -5.49% vs 26.98% in Dec 2025
Half Yearly Results Snapshot (Consolidated) - Sep'25
Growth in half year ended Sep 2025 is 30.54% vs 85.29% in Sep 2024
Growth in half year ended Sep 2025 is 21.49% vs 173.85% in Sep 2024
Nine Monthly Results Snapshot (Consolidated) - Dec'25
YoY Growth in nine months ended Dec 2025 is 40.97% vs 58.54% in Dec 2024
YoY Growth in nine months ended Dec 2025 is 32.24% vs 38.57% in Dec 2024
Annual Results Snapshot (Consolidated) - Mar'26

YoY Growth in year ended Mar 2026 is 46.08% vs 37.12% in Mar 2025
YoY Growth in year ended Mar 2026 is 27.72% vs 29.44% in Mar 2025
About DRC Systems India Ltd

Company Coordinates


